Figures & data
Figure 1. Schematic illustration of the preparation of the BRI@SR@PT and its application on rabbit eyes. (a) The fabrication process of the BRI@SR@PT including modification, BRI-loading, PDA/TPU coating. (b) Administration of the BRI@SR@PT into the conjunctival sac of rabbit eyes. (c) Investigation of the IOP-lowering effect by detecting drug concentration in aqueous humor and measuring intraocular pressure (IOP). R.T., room temperature.
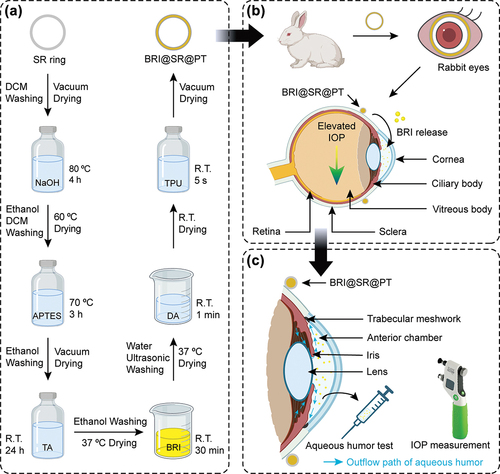
Figure 2. Morphologies of the modified SR, BRI@SR, BRI@SR@PDA, and BRI@SR@PT. (a) Representative images of the inserts before and after surface modification, drug loading, and PDA/TPU coating captured by a digital camera. (b,c) Surface and cross-section SEM images of the inserts.
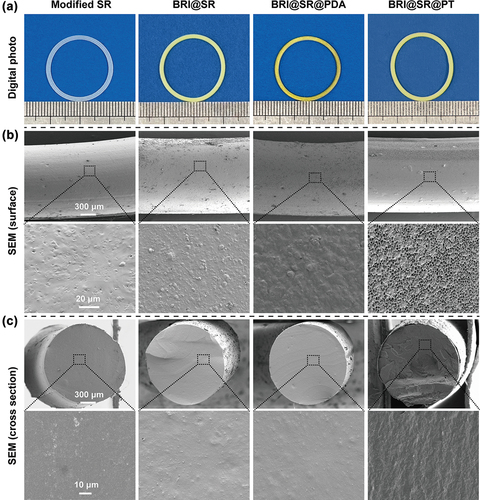
Figure 3. (a) FTIR spectra of TA, BRI, APTES, and SR before and after modification, BRI-loading, and PDA coating. Associated characteristic peaks have been indicated by dotted lines. (b,c) Thermogravimetry (TG) analysis, (d) differential scanning calorimetry (DSC) analysis, and (e) stress-strain tensile curves of the modified SR, BRI@SR, BRI@SR@PDA, and BRI@SR@PT.
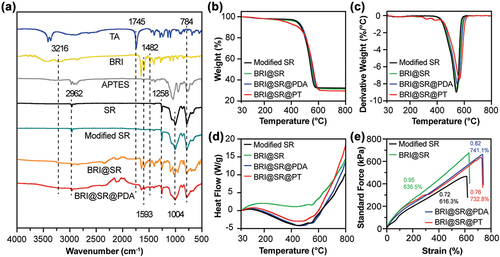
Figure 4. In vitro cytocompatibility of BRI@SR@PDA and BRI@SR@PT. (a) Fluorescence images of HCECs and MICECs after 24 h incubation with the leaching liquors of BRI@SR@PDA or BRI@SR@PT. Calcein-AM/PI staining photos showed dead cells as red and live cells as green. (b) Histogram of cell viability of the above treated HCECs and MICECs.
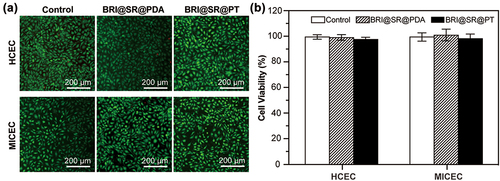
Figure 5. In vitro short-term and long-term immediate BRI release profiles (a, b) and cumulative BRI release profiles (c, d) of BRI@SR, BRI@SR@PDA, and BRI@SR@PT (n = 4).
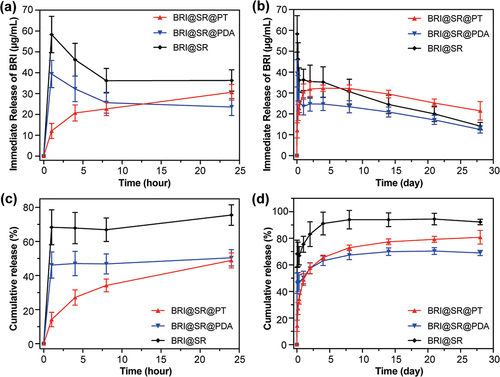
Figure 6. In vivo BRI concentration in rabbit aqueous humor and IOP-lowering effects after administration of the BRI@SR@PT or BRI eye drops (0.15% w/w). (a, b) The curves and histograms of BRI concentration in aqueous humor (four rabbits survived to the final observation point and n = 4). (c, d) The short-term and long-term IOP curves (n = 5) during 28 d. Plots with * or # represent statistically significant differences compared to that in the control group (no any operation) or BRI eye drop group.
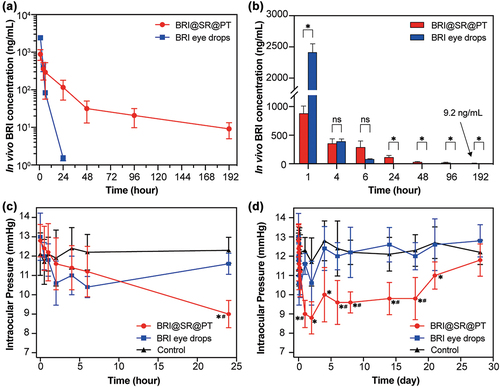
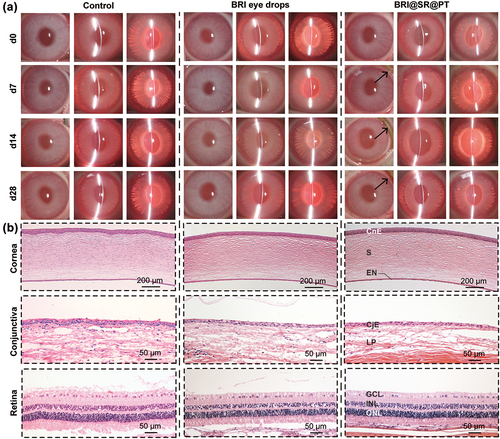
Figure 7. (a) Representative photographs of the anterior segments of rabbit eyes in the control, BRI eye drops (0.15% w/w), and BRI@SR@PT groups. Three kinds of slit lamp modes including diffuse illumination, direct focal illumination, and retro-illumination were used for the examination of the anterior segments of rabbit eyes. The BRI@SR@PTs administered in the conjunctival sacs of rabbit eyes were marked with black arrows. (b) Representative H&E staining images of cornea, conjunctiva, and retina in three groups. CnE, corneal epithelial layer; CjE, conjunctival epithelial layer; S, stroma; EN, endothelial layer; LP, lamina propria; GCL, ganglion cell layer; INL, inner nuclear layer; ONL, outer nuclear layer.