
Figures & data
Figure 1. Illustration of the flip-flop pharmacokinetics after intramuscular administration for which the rate of elimination (kel) is faster than the rate of absorption (ka) as opposed to oral administration.
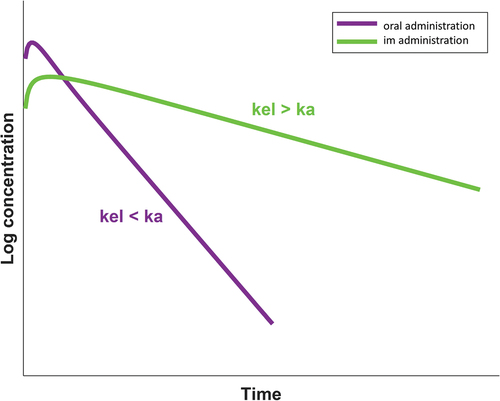
Figure 2. Drug profile after oral (left) and intramuscular (right) administration and impact of inducers or inhibitors on the elimination half-life.
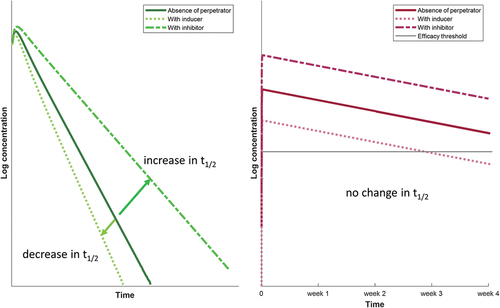
Table 1. Proportion of individuals with cabotegravir and rilpivirine concentrations above the efficacy threshold during the intramuscular administration dosing interval for various simulated DDI scenarios. Reprinted from reference [Citation7], with permission from Oxford University Press License.