Figures & data
Figure 1. dTMS system on a rolling medical cart including a cooling system, stimulator, interface module for double blind experiments, positioning arm and one helmet.
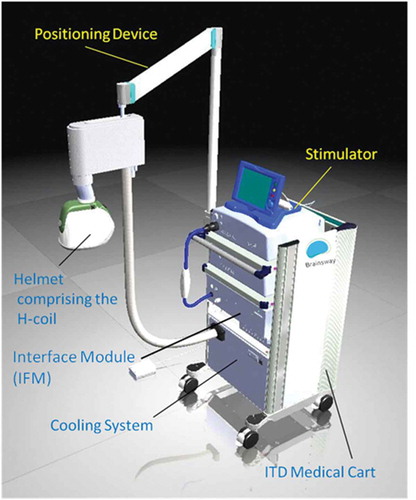
Table 1. Specifications of the different H-coils.
Figure 2. Colored field maps for the H1-coil indicating the absolute magnitude electrical field in each pixel at 120% of hand motor threshold, for 10 coronal slices 1 cm apart. Red pixels indicate regions with field intensity above the threshold for neuronal activation. The figure is in-press and is open access [Citation79]. Full color available online.
![Figure 2. Colored field maps for the H1-coil indicating the absolute magnitude electrical field in each pixel at 120% of hand motor threshold, for 10 coronal slices 1 cm apart. Red pixels indicate regions with field intensity above the threshold for neuronal activation. The figure is in-press and is open access [Citation79]. Full color available online.](/cms/asset/e905d552-89fd-4e76-a711-eb244d775b5c/ierd_a_1233812_f0002_oc.jpg)
Figure 3. Colored field maps for the H2-coil indicating the absolute magnitude electrical field in each pixel at 120% of hand motor threshold, for 16 coronal slices 1 cm apart. Red pixels indicate regions with field intensity above the threshold for neuronal activation. Full color available online.
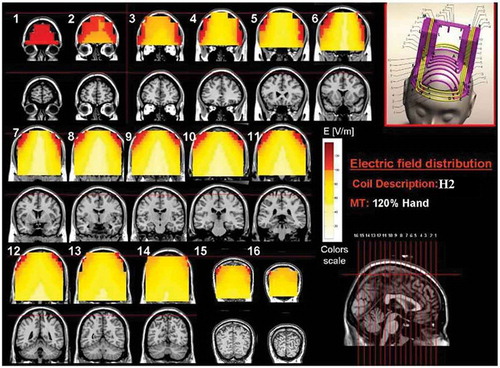
Figure 4. Colored field maps for the H3-coil indicating the absolute magnitude electrical field in each pixel at 120% of foot motor threshold, for 9 coronal slices 1 cm apart. Red pixels indicate regions with field intensity above the threshold for neuronal activation. Full color available online.
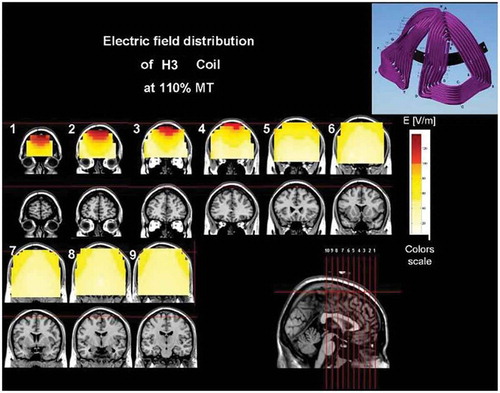
Figure 5. Colored field maps for the H4-coil indicating the absolute magnitude electrical field in each pixel at 120% of hand motor threshold, for 14 coronal slices 1 cm apart. Red pixels indicate regions with field intensity above the threshold for neuronal activation. Full color available online.
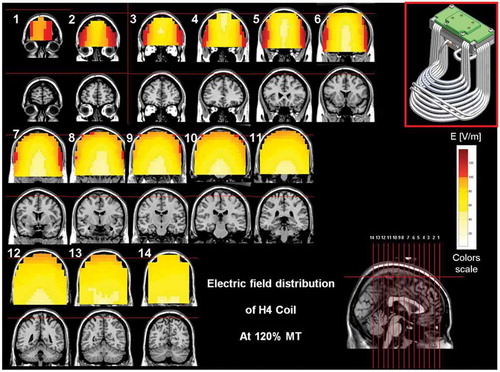
Figure 6. Colored field maps for the H5-coil indicating the absolute magnitude electrical field in each pixel at 120% of hand motor threshold, for 14 coronal slices 1 cm apart. Red pixels indicate regions with field intensity above the threshold for neuronal activation. Full color available online.
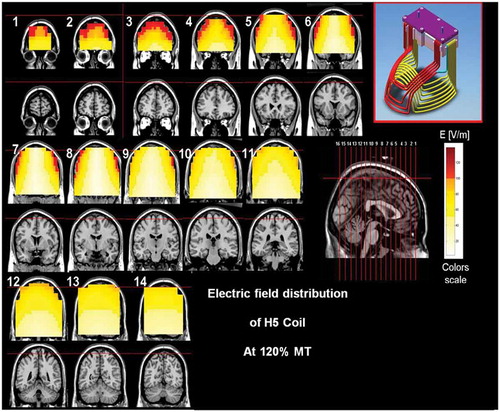
Figure 7. Colored field maps for the H6-coil indicating the absolute magnitude electrical field in each pixel at 120% of hand motor threshold, for 11 coronal slices 1 cm apart. Red pixels indicate regions with field intensity above the threshold for neuronal activation. Full color available online.
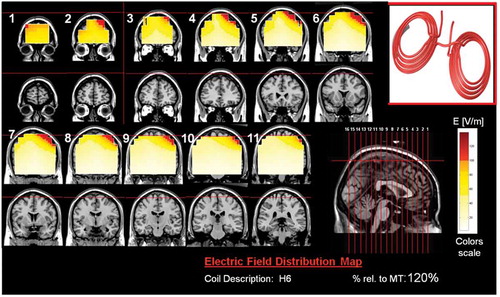
Figure 8. Colored field maps for the H7-coil indicating the absolute magnitude electrical field in each pixel at 100% of foot motor threshold, for 14 coronal slices 1 cm apart. Red pixels indicate regions with field intensity above the threshold for neuronal activation. Full color available online.
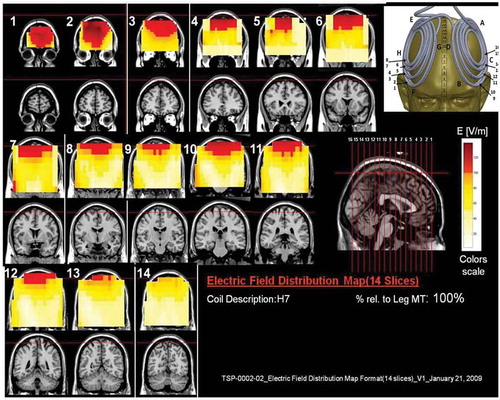
Figure 9. Colored field maps for the H8-coil indicating the absolute magnitude electrical field in each pixel at 120% of hand motor threshold, for 14 coronal slices 1 cm apart. Red pixels indicate regions with field intensity above the threshold for neuronal activation. Full color available online.
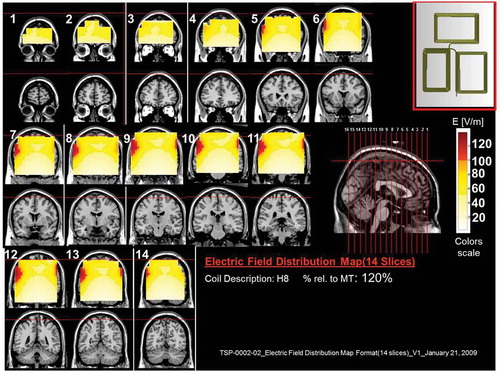
Figure 10. Colored field maps for the H9-coil indicating the absolute magnitude electrical field in each pixel at 110% of foot motor threshold, for 16 coronal slices 1 cm apart. Red pixels indicate regions with field intensity above the threshold for neuronal activation. Full color available online.
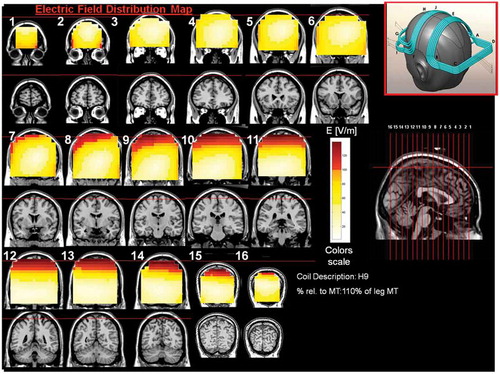
Figure 11. Colored field maps for the H10-coil indicating the absolute magnitude electrical field in each pixel at 100% of foot motor threshold, for 14 coronal slices 1 cm apart. Red pixels indicate regions with field intensity above the threshold for neuronal activation. Full color available online.
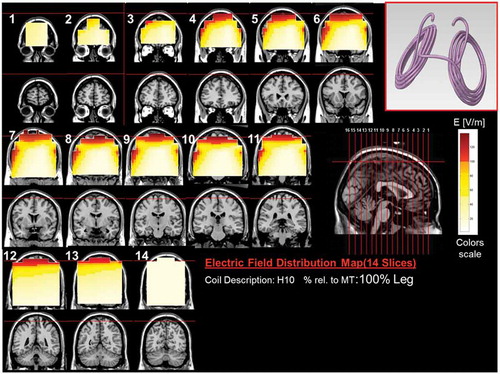
Figure 12. Colored field maps for the H11-coil indicating the absolute magnitude electrical field in each pixel at 120% of hand motor threshold, for 14 coronal slices 1 cm apart. Red pixels indicate regions with field intensity above the threshold for neuronal activation. Full color available online.
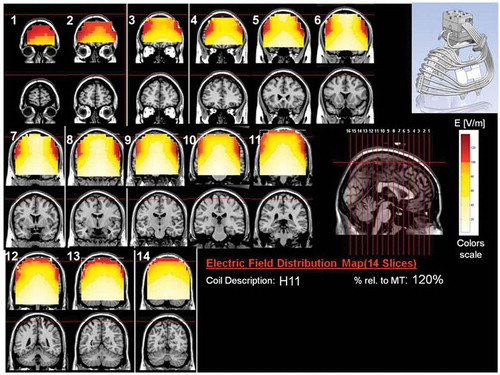
Figure 13. Colored field maps for the H12-coil indicating the absolute magnitude electrical field in each pixel at 100% of hand motor threshold, for 14 coronal slices 1 cm apart. Red pixels indicate regions with field intensity above the threshold for neuronal activation. Full color available online.
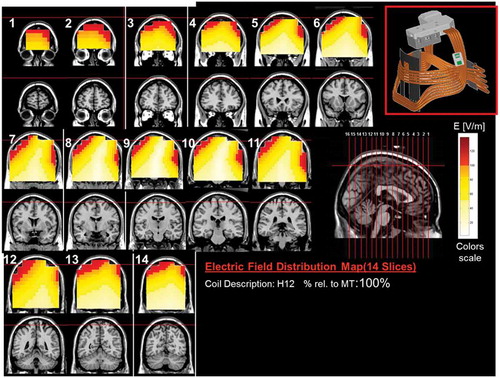
Figure 14. Colored field maps for the H13-coil indicating the absolute magnitude electrical field in each pixel at 120% of hand motor threshold, for 14 coronal slices 1 cm apart. Red pixels indicate regions with field intensity above the threshold for neuronal activation. Full color available online.
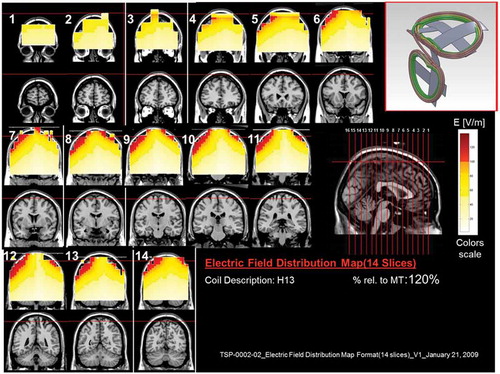
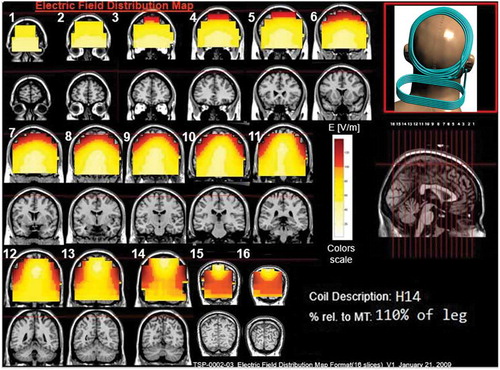
Figure 15. Colored field maps for the H14-coil indicating the absolute magnitude electrical field in each pixel at 110% of leg motor threshold, for 16 coronal slices 1 cm apart. Red pixels indicate regions with field intensity above the threshold for neuronal activation. Full color available online.