Figures & data
Table 1. Techniques for assessment of viability and scar.
Figure 1. The 252-lead vest records torso surface electrograms. Reproduced with permission from MEDTRONIC.

Figure 2. Comparison of sites of LEA (A) and LMA (B). The circled numbers refer to the patient numbers. Reproduced with permission from Wiley.
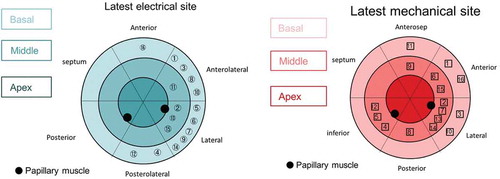
Figure 3. (A) (Top left) Anteroposterior venogram with overlay of CMR-derived epicardial/endocardial shell with 16-segment American Heart Association model showing an anterior interventricular vein. The 3D CMR-derived shell has the same colors as displayed in the guidance platform as shown in and . Infero-septal, antero-septal, and anterior segments are colored in yellow, green, and blue, respectively. (Top right) left anterior oblique (LAO) 20 venogram with automated rotation and alignment of the 16-segment model with the x-ray. Inferolateral veins are demonstrated. (Bottom left) LAO 40 projection. The positioning of a quadripolar left ventricular lead into a preselected target segment (green). (Bottom right) LAO 40 projection, alternate view with CMR-derived scar distribution (red). Attempted positioning and pacing using left ventricular poles out of regions of scar. Reproduced with permission from Elsevier due to the creative commons license. (B) This display screen is seen following the processing of the CMR data set and is mimicked on the large screen in the catheter laboratory. Total scar burden calculated as a mean of all myocardial segments. (Top middle) Scar distribution denoted in grey upon an American Heart Association 16-segment model. (Top right) Scar burden (% scar per myocardial segment volume), displayed in 5% ranges. (Bottom right) Scar transmurality demonstrating the mean transmurality from endocardium to epicardium. Those segments >50% transmural myocardial fibrosis are also denoted in red. (Bottom left) Mechanical activation curves for the 16 segments, corresponding to the colors shown in the middle panels. Endocardial tracking of the left ventricle provides absolute changes in the volume per segment (ml, y axis) over the cardiac cycle (0% end diastole, 30% to 50% end systole, 100% end diastole). Because these are absolute volume changes, the apical segments are always at the bottom because they have a smaller start and end volume. When the user hovers over a segment in the top middle panel, the associated volume time curve appears in bold; in this case, the target posterolateral segment is shown. (Bottom middle) Target selection panel. Upon reviewing the scar location, burden, transmurality, and mechanical activation curves, target segments are chosen (seen here in white; basal anterior, mid-posterolateral). EDV 1⁄4 end-diastolic volume; EF 1⁄4 ejection fraction; ESV 1⁄4 end-systolic volume; SDI 1⁄4 systolic dyssynchrony using endocardial tracking of CMR cine images in short and long axis. Reproduced with permission from Elsevier due to the creative commons license. Full color available online.
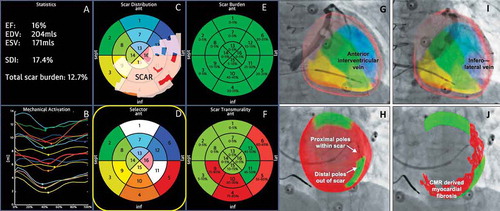
Figure 4. (A) Target venous site for LV lead placement. Major LV veins were drawn on fluoroscopic venograms, reconstructed to a 3D structure, and fused with SPECT LV epicardial surface. The mid part of AV (blue line) was aligned with the optimal segment (white segment), and so was targeted for lead placement. (B) Post-implant fluoroscopy. The LV lead was placed using the guidance in (A). The post-implant images show that the LV lead (red arrows) was on target. (C) Post-implant electrocardiogram. The QRS duration decreased from 168 to 140 ms immediately after the cardiac resynchronization therapy (CRT) device was turned on. RAO 1⁄4 right anterior oblique. Reproduced with permission from Elsevier.
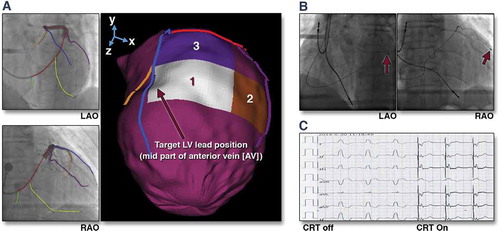
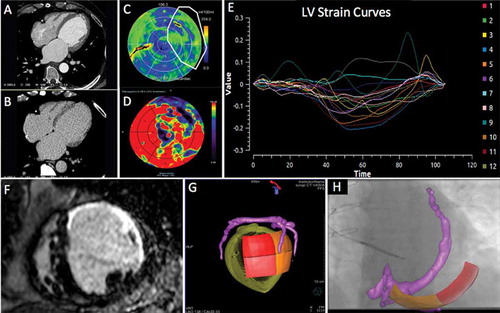
Figure 5. Series of (Dual Energy CT) DECCT-derived scar and image overlay of the coronary sinus and optimal target segment derived from CT strain measurements from one patient: Retrospective CCT demonstrating calcification in a left anterior descending (LAD) and circumflex territory infarct (A). Dual-energy CCT demonstrating subtle ventricular scar in the LAD and circumflex territory (B). Late iodinated enhancement plotted on American Heart Association (AHA) 17-segment bull’s-eye plot suggesting scar in the LAD and circumflex territory but also artifact from an existing RV pacing lead in the basal to mid-antero-septum (C). First pass iodine uptake plotted on an AHA 17-segment bull’s-eye plot showing what we believe to be residual iodine predominately in the LAD and circumflex territory (D). CCT-derived dyssynchrony curves calculated by myocardial strain (E). Cardiac magnetic resonance short axis image of the mid-LV showing late gadolinium enhancement of the same patient taken 2 years prior to any device implantation for comparison purposes (F). Pre-procedure DECCT-derived coronary sinus segmentation fused with latest mechanical activating segments determined from DECCT-derived strain (G) co-registered and overlaid onto live fluoroscopy using fusion software (H). Reproduced with permission from Oxford University Press.