Figures & data
Figure 1. Submillimeter targeting with tightly spaced electrodes and multiple current sources
(a) Zoomed in illustration of dual (1 x 16) percutaneous leads at typical T7-T9 placement (see inset) and with active cathodes (green) and anodes (violet) sinking/sourcing various percentages (numerals on electrodes) of the total current. A model-based field steering algorithm uses the multiple independent current sources to assign specific currents in a manner that generates a virtual cathode (green ‘A’) and a virtual anode (violet ‘A’) [Citation15]. (b) Biphasic-symmetric waveforms produce multiple points of stimulation. Illustrative example of biphasic-symmetric waveforms at 90 Hz (frequency) and 200 µs (pulse width) as generated at physical electrodes E4, E7, E20, and E23. During the first rectangular phase of the biphasic stimulating waveform, negative current is injected through negatively configured contacts (‘cathodes’, green, 27%+17%+31%+17%+8% = 100%), and positive current is injected through positively configured return contacts (‘anodes’, violet, 22%+13%+37%+22%+6% = 100%). During the second rectangular phase, charge balance is achieved by reversing polarities (i.e. the current is anodic at the assigned cathode and vice versa). Note the different current amplitudes on different electrodes enabled by multiple current sources and used for fine-tuning the stimulation location. Current fractionalization of physical cathodic and anodic electrode contacts produces a ‘virtual’ cathode and anode as indicated under ‘A’ (green: virtual cathode; violet: virtual anode), thereby enabling higher resolution steering of the applied electrical field.
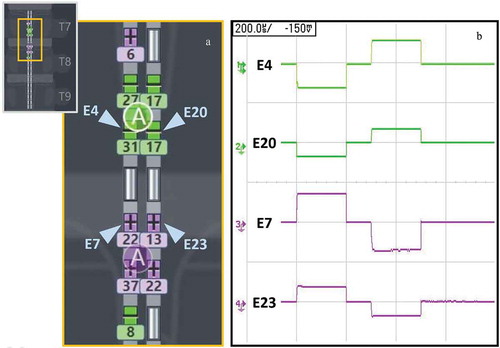
Figure 2. Patient disposition
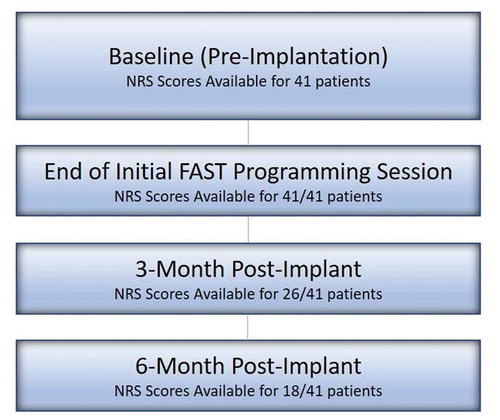
Table 1. Baseline demographic characteristics in analyzed patients (n/N)
Figure 3. Pain reduction at initial programming session using FAST
Pre-FAST activation (Red bars; n = 41): NRS before the start of the programming session (≥12 hours of no stimulation with the device turned off). Post-FAST activation (Blue bars; n = 41): NRS as measured after FAST stimulation is turned on. (a) Mean Overall Pain (b) Mean Back Pain (c) Mean Leg Pain [1 patient included in this cohort did not report leg pain] (d) Distribution of time intervals between FAST therapy activation and pain recording (n = 34; time interval data were only available for 34 out of the 41 total patients assessed during the FAST programming session). Error bars denote standard error. Significant difference (p < 0.0001) from Pre-FAST stim off is denoted by an asterisk.
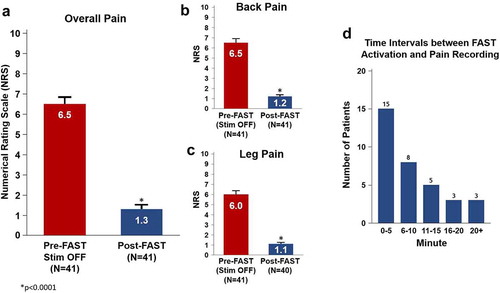
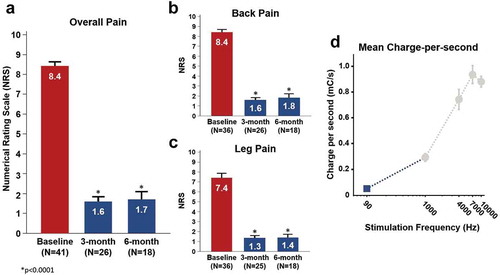
Figure 4. Pain reduction and charge expenditure using FAST
Pre-Implant Baseline (Red bars; n = 41): NRS before device implantation. Follow-Up visit (Blue bars): NRS as measured at the 3-month (n = 26) and 6-month (n = 18). (a) Mean Overall Pain (b) Mean Back Pain (c) Mean Leg Pain (d) Mean Charge-Per-Second computed with FAST (blue square) plotted with prior work at higher frequencies (gray circles) [Citation8]. Error bars denote standard error. Significant difference (p < 0.0001) from Baseline is denoted by an asterisk.