
Figures & data
Figure 1. (a): The SEM Scanner 200 (b): The Provizio® SEM Scanner
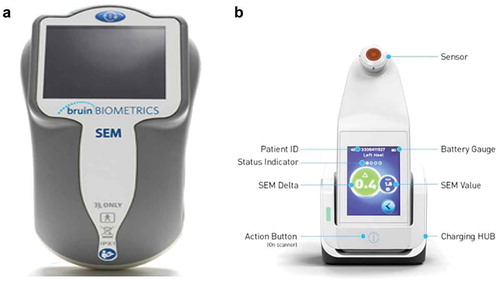
Figure 2. Wall to patient/user and the isolation barrier enabling reinforced insulation between the SEM Scanner and the patient
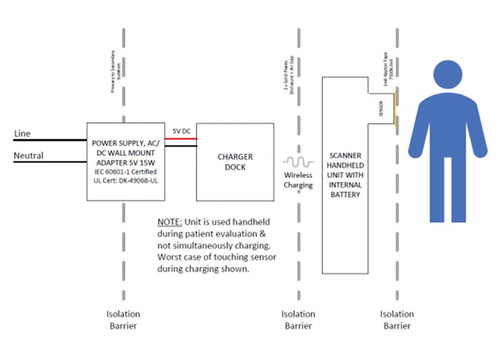
Figure 3. Claims-Data-Value Framework- Evidence pyramid in the development of SEM Scanner technology
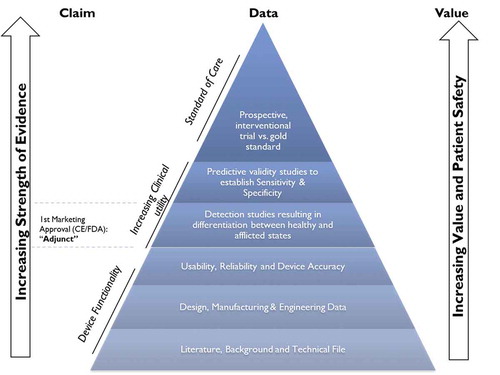
Figure 4. Receiver operating characteristic curve for performance of algorithms A and B relative to the gold standard of skin and tissue assessment in combination with clinical judgment. Receiver operating characteristic curve illustrating diagnostic sensitivity and specificity of the SEM Scanner algorithms in early detection of deep and early stage pressure-induced injury. AUC, area under the curve. CI, confidence Intervals. Figure adapted from Gershon et al, 2021 .[Citation45]
![Figure 4. Receiver operating characteristic curve for performance of algorithms A and B relative to the gold standard of skin and tissue assessment in combination with clinical judgment. Receiver operating characteristic curve illustrating diagnostic sensitivity and specificity of the SEM Scanner algorithms in early detection of deep and early stage pressure-induced injury. AUC, area under the curve. CI, confidence Intervals. Figure adapted from Gershon et al, 2021 .[Citation45]](/cms/asset/e78f8ae1-b05b-4a6b-9446-efd25df292b5/ierd_a_1960505_f0004_oc.jpg)
Table 1. Foundational studies of the SEM Scanner evaluated by the Food and Drug Administration (FDA) prior to regulatory De Novo approval
Figure 5. Receiver operating characteristic curve for performance of the SEM Scanner relative to the gold standard of skin and tissue assessment in combination with clinical judgment. Receiver operating characteristic curve illustrating diagnostic sensitivity and specificity of the SEM Scanner in early detection of deep and early stage pressure-induced injury. AUC, area under the curve. CI, confidence Intervals. Figure reprinted with permissions from Okonkwo et al, 2020 .[Citation44]
![Figure 5. Receiver operating characteristic curve for performance of the SEM Scanner relative to the gold standard of skin and tissue assessment in combination with clinical judgment. Receiver operating characteristic curve illustrating diagnostic sensitivity and specificity of the SEM Scanner in early detection of deep and early stage pressure-induced injury. AUC, area under the curve. CI, confidence Intervals. Figure reprinted with permissions from Okonkwo et al, 2020 .[Citation44]](/cms/asset/bc44ed15-5536-4ed4-a50d-7451e7df0856/ierd_a_1960505_f0005_oc.jpg)
Figure 6. Pressure injury (PI) incidence reduction rates using the SEM Scanner as an adjunct in daily PI care practice
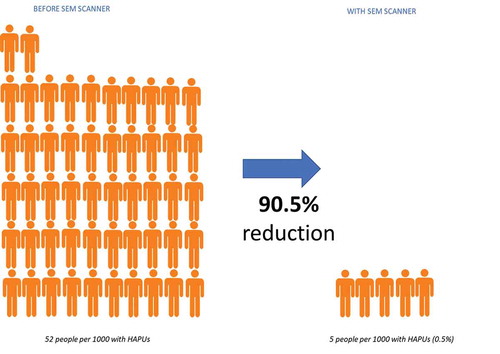
Table 2. Regulatory approval of the SEM Scanner series – SEM Scanner 200 and the Provizio® SEM Scanner