Figures & data
Figure 1. Technical properties of the various FDA-cleared TMS coils.
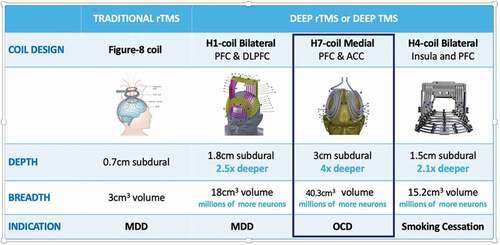
Figure 2. Clinical outcomes following Deep TMS H7 Coil treatment in the OCD pilot and multicenter trials (adapted from [Citation3] and [Citation4]). (a) outcomes in the pilot study: on the left panel mean % change from baseline in Y-BOCS scores throughout the trial in black circles for the active treatment group and in white circles for the sham group. On the right panel the response rates (defined as ≥30% reduction from baseline Y-BOCS) are presented for the active treatment group on the right bar and for sham on the left bar. (b) outcomes in the multicenter study: on the left panel mean change from baseline in Y-BOCS scores throughout the trial in green circles for the active treatment group and in Orange circles for the sham group. Numbers above line graphs represent number of subjects with available scores for that timepoint. On the right panel the response rates (full and partial response defined as ≥30% and ≥20% reduction from baseline Y-BOCS, respectively) are presented for the active treatment group in green bars and for sham in Orange bars. Asterisks denote statistical significance *-p < 0.05, **-p < 0.01.
![Figure 2. Clinical outcomes following Deep TMS H7 Coil treatment in the OCD pilot and multicenter trials (adapted from [Citation3] and [Citation4]). (a) outcomes in the pilot study: on the left panel mean % change from baseline in Y-BOCS scores throughout the trial in black circles for the active treatment group and in white circles for the sham group. On the right panel the response rates (defined as ≥30% reduction from baseline Y-BOCS) are presented for the active treatment group on the right bar and for sham on the left bar. (b) outcomes in the multicenter study: on the left panel mean change from baseline in Y-BOCS scores throughout the trial in green circles for the active treatment group and in Orange circles for the sham group. Numbers above line graphs represent number of subjects with available scores for that timepoint. On the right panel the response rates (full and partial response defined as ≥30% and ≥20% reduction from baseline Y-BOCS, respectively) are presented for the active treatment group in green bars and for sham in Orange bars. Asterisks denote statistical significance *-p < 0.05, **-p < 0.01.](/cms/asset/e14a1a13-6f4c-4b61-92eb-222b5ef695ac/ierd_a_2013803_f0002_oc.jpg)
Figure 3. Characterization of the response to Deep TMS H7 Coil among different OCD patient populations (adapted from [Citation5,Citation6], and [][Citation7]). (a) mean change from baseline in Y-BOCS scores throughout the multicenter trial among 2 subsets of patients: lower baseline severity (Y-BOCS<27, upper panel) and higher baseline severity (Y-BOCS≥28, bottom panel) presented in red line graphs for active treatment group and in blue line graph for sham. (b) schematic timeline of the study (top panel), samples sizes and response rates (middle panel), and the percent of change from baseline in Y-BOCS scores for each individual from the different cohorts at the end of the 6-weeks treatment and at the 10-weeks Follow-up (bottom panel). (c) improvement in clinical symptoms of comorbid OCD-MDD patients from the real-world post-marketing data. Mean ± SEM % change in Y-BOCS and MDD scores from baseline as a function of number of Deep TMS sessions. Scatter plot demonstrating the correlation of improvement in both scores is shown in the top right insert. Asterisks denote a significant response rate difference between the indicated groups, where *p < 0.05, **p < 0.01 (Fisher’s exact test).
![Figure 3. Characterization of the response to Deep TMS H7 Coil among different OCD patient populations (adapted from [Citation5,Citation6], and [][Citation7]). (a) mean change from baseline in Y-BOCS scores throughout the multicenter trial among 2 subsets of patients: lower baseline severity (Y-BOCS<27, upper panel) and higher baseline severity (Y-BOCS≥28, bottom panel) presented in red line graphs for active treatment group and in blue line graph for sham. (b) schematic timeline of the study (top panel), samples sizes and response rates (middle panel), and the percent of change from baseline in Y-BOCS scores for each individual from the different cohorts at the end of the 6-weeks treatment and at the 10-weeks Follow-up (bottom panel). (c) improvement in clinical symptoms of comorbid OCD-MDD patients from the real-world post-marketing data. Mean ± SEM % change in Y-BOCS and MDD scores from baseline as a function of number of Deep TMS sessions. Scatter plot demonstrating the correlation of improvement in both scores is shown in the top right insert. Asterisks denote a significant response rate difference between the indicated groups, where *p < 0.05, **p < 0.01 (Fisher’s exact test).](/cms/asset/69839eb0-1235-4f5f-b0fe-86600ba35bb3/ierd_a_2013803_f0003_oc.jpg)
Figure 4. Effect of treatment with Deep TMS H7 Coil on theta power and task performance (adapted from [Citation3,Citation42]). (a) average theta power in the active treatment group in black bars and sham treatment group in white bars following correct and mistake responses, pre-treatment (left) and post-treatment (right). (b) correlation between changes in Y-BOCS scores and ERN amplitudes (Pre-minus post-treatment) for the active treatment group (left; r = 0.63, p < 0.01) and sham treatment group (right; r = −0.42, p < 0.26). (c) average RTs (left) following correct and erroneous responses, and accuracy (right) following correct and erroneous responses. (d) correlation between changes in PEA and PES following active treatment (left) and following sham treatment (right). Data are presented as Mean ± SEM. *p < 0.05, **p < 0.01, ***p < 0.001.
![Figure 4. Effect of treatment with Deep TMS H7 Coil on theta power and task performance (adapted from [Citation3,Citation42]). (a) average theta power in the active treatment group in black bars and sham treatment group in white bars following correct and mistake responses, pre-treatment (left) and post-treatment (right). (b) correlation between changes in Y-BOCS scores and ERN amplitudes (Pre-minus post-treatment) for the active treatment group (left; r = 0.63, p < 0.01) and sham treatment group (right; r = −0.42, p < 0.26). (c) average RTs (left) following correct and erroneous responses, and accuracy (right) following correct and erroneous responses. (d) correlation between changes in PEA and PES following active treatment (left) and following sham treatment (right). Data are presented as Mean ± SEM. *p < 0.05, **p < 0.01, ***p < 0.001.](/cms/asset/c71e79a6-f2a1-4af8-8753-2b2a1c70e3ec/ierd_a_2013803_f0004_b.gif)
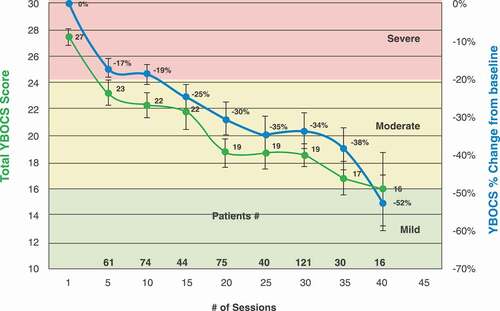
Figure 5. Change in clinical response as a function of number of treatment sessions with Deep TMS H7 Coil (modified from Citation43,Citation43). Total Y-BOCS score (green line) and % change from baseline in Y-BOCS score (blue line). Shown as means ± SEMs. Numbers above the x axis indicate numbers of subjects who had Y-BOCS scores at the respective number of sessions.