
Figures & data
Table 1. Demographic characteristics of patients treated with CTR-US or mOCTR.
Figure 1. Device used for carpal tunnel release with ultrasound guidance. Key device characteristics include: 1) blunt dissecting rigid polymer tip; 2) two laterally located polymer balloons (inflated in figure); 3) retractable stainless-steel retrograde cutting blade (in active position in figure); 4) handle housing device controls.
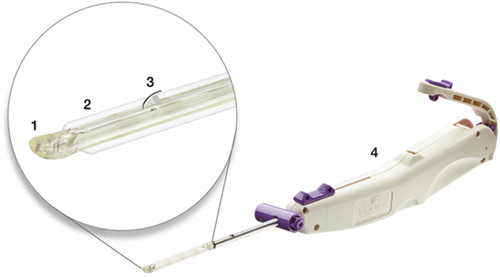
Table 2. Clinical characteristics of patients treated with CTR-US or mOCTR.
Table 3. Procedural details in patients treated with CTR-US or mOCTR.
Figure 2. Representative wound healing images in heavy manual laborers 1 week after CTR-US using a wrist incision (left) and mOCTR using a palmar incision (right).
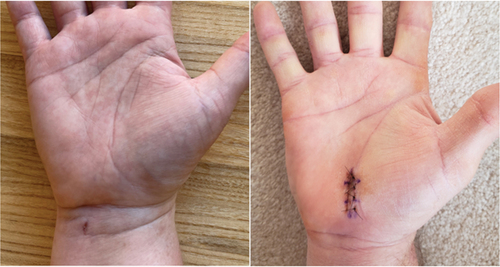
Figure 3. BCTQ-SSS and BCTQ-FSS scores over 3 months following CTR-US and mOCTR. Plotted values are baseline-adjusted least squares mean change and 95% confidence interval. (top) at 3 months, the mean change for BCTQ-SSS was − 1.46 for CTR-US and − 1.54 for mOCTR (p = 0.46 between groups). The mean change in each group was statistically significant compared to baseline (both p < 0.001) and exceeded the minimal clinically important difference of a 1.14-point decrease denoted by the green shaded area [Citation18]. (bottom) at 3 months, the mean change for BCTQ-FSS was − 0.83 for CTR-US and − 0.84 for mOCTR (p = 0.92 between groups). The mean change in each group was statistically significant compared to baseline (both p < 0.001) and exceeded the minimal clinically important difference of a 0.74-point decrease denoted by the green shaded area [Citation18].
![Figure 3. BCTQ-SSS and BCTQ-FSS scores over 3 months following CTR-US and mOCTR. Plotted values are baseline-adjusted least squares mean change and 95% confidence interval. (top) at 3 months, the mean change for BCTQ-SSS was − 1.46 for CTR-US and − 1.54 for mOCTR (p = 0.46 between groups). The mean change in each group was statistically significant compared to baseline (both p < 0.001) and exceeded the minimal clinically important difference of a 1.14-point decrease denoted by the green shaded area [Citation18]. (bottom) at 3 months, the mean change for BCTQ-FSS was − 0.83 for CTR-US and − 0.84 for mOCTR (p = 0.92 between groups). The mean change in each group was statistically significant compared to baseline (both p < 0.001) and exceeded the minimal clinically important difference of a 0.74-point decrease denoted by the green shaded area [Citation18].](/cms/asset/77aade34-eab8-4c92-bd25-cc8bbddf6c59/ierd_a_2218548_f0003_oc.jpg)
Figure 4. Numeric Pain Scale scores over 3 months following CTR-US and mOCTR. Plotted values are baseline-adjusted least squares mean change and 95% confidence interval. At 3 months, the mean change was − 3.2 for CTR-US and − 3.8 for mOCTR (p = 0.09 between groups). The mean change in each group was statistically significant compared to baseline (both p < 0.001) and exceeded the minimal clinically important difference of a 2-point decrease denoted by the green shaded area [Citation19].
![Figure 4. Numeric Pain Scale scores over 3 months following CTR-US and mOCTR. Plotted values are baseline-adjusted least squares mean change and 95% confidence interval. At 3 months, the mean change was − 3.2 for CTR-US and − 3.8 for mOCTR (p = 0.09 between groups). The mean change in each group was statistically significant compared to baseline (both p < 0.001) and exceeded the minimal clinically important difference of a 2-point decrease denoted by the green shaded area [Citation19].](/cms/asset/fd6034ee-a6a7-45b2-bf1f-4997bf821eba/ierd_a_2218548_f0004_oc.jpg)
Figure 5. EQ-5D-5 L scores over 3 months following CTR-US and mOCTR. Plotted values are baseline-adjusted least squares mean change and 95% confidence interval. At 3 months, the mean change was 0.11 for CTR-US and 0.12 for mOCTR (p = 0.90 between groups). The mean change in each group was statistically significant compared to baseline (both p < 0.001) and exceeded the minimal clinically important difference of a 0.09-point increase denoted by the green shaded area [Citation20].
![Figure 5. EQ-5D-5 L scores over 3 months following CTR-US and mOCTR. Plotted values are baseline-adjusted least squares mean change and 95% confidence interval. At 3 months, the mean change was 0.11 for CTR-US and 0.12 for mOCTR (p = 0.90 between groups). The mean change in each group was statistically significant compared to baseline (both p < 0.001) and exceeded the minimal clinically important difference of a 0.09-point increase denoted by the green shaded area [Citation20].](/cms/asset/3214db03-fdbc-4083-b84e-d97a63b40d94/ierd_a_2218548_f0005_oc.jpg)
Table 4. Results of intention-to-treat, as-randomized analysis.*
Supplemental Material
Download MS Word (241.6 KB)Data availability statement
Raw data will not be available because the clinical trial remains in progress.