Figures & data
Figure 1. Effects of Ni NPs on different sperm parameters. Plasma membrane lipid peroxidation, mitochondrial membrane potential, DNA integrity, and sperm-fertilizing ability were evaluated after 2 h sperm exposure to different Ni NPs nominal concentrations. Data were reported as mean ± SD, n = 10. a, b, c, d, e denote highly significant difference, p < 0.01.
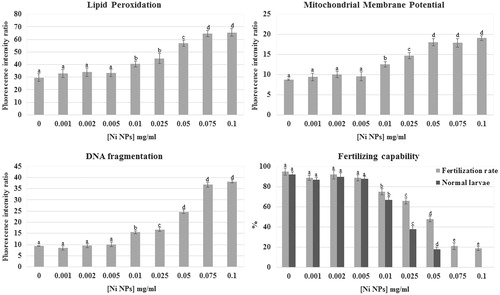
Table 1. Effects of NiCl2 exposure on sperm quality parameters and fertilizing ability.
Figure 2. Effects of Ni NPs on the offspring. Representative images of: (A) embryo arrested at different developmental stages and (B) abnormal larvae developed from fertilization performed with sperm exposed to Ni NPs. Insert show (A) normal embryo at the critical stage of eight blastomeres and (B) normal hatched larva. Scale bars are 50 μm.
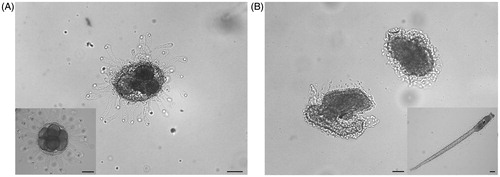
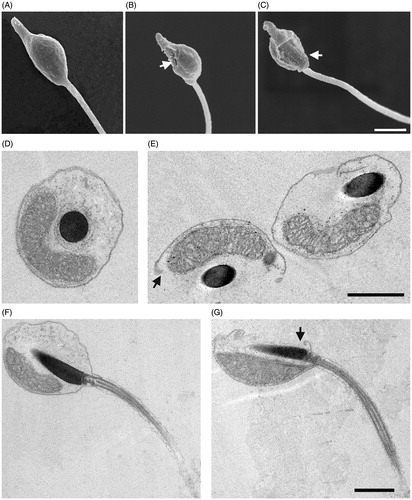
Figure 3. Effects of Ni NPs on sperm ultrastructure. Representative SEM images of control sperm (A) and sperm exposed for 2 h to Ni NPs at concentrations higher than 0.025 (B, C) show holes in the plasma membrane indicated by arrows. TEM images of transversal and longitudinal sections of control sperm (D, F) and sperm (E, G) exposed as above that show interruptions of plasma membrane continuity as indicated by arrows. Scale bars are 1 μm.