Figures & data
Figure 1. AFM particle characterization of silver garment: (A) AFM height image of a silver coated fiber (vertical scale of 600 nm); (B) height profile along indicated lines. Arrow indicates particle height analysis taking into account the fiber curvature. (C) Histogram of particle height distribution (117 particles were analyzed). Red curve (Line 1) represents empirical distribution and the blue curve (Line 2) represents theoretical Gumbel distribution with parameters a = 36.2 and b = 15.9.
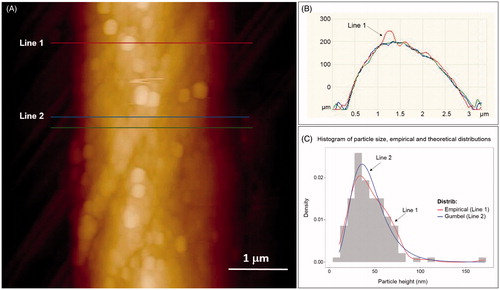
Figure 2. SEM image of the fiber surface on the silver containing garment: (A) low (1000×) magnification illustrating overall appearance of fibers (white square indicates location of EDX spectra collection); (B) increased (5000×) magnification (area inside yellow rectangle in panel A) illustrating rough appearance of coating on fiber surfaces; (C) increased (50 000×) magnification (area inside yellow rectangle in panel B) illustrating roughness is due to presence of nanoparticles coating fibers; and (D) SEM-EDX spectra from SEM image A (white square) demonstrating that the nanoparticles coating the fibers are composed of silver (purple tags = silver, green tag = oxygen, orange tag = carbon).
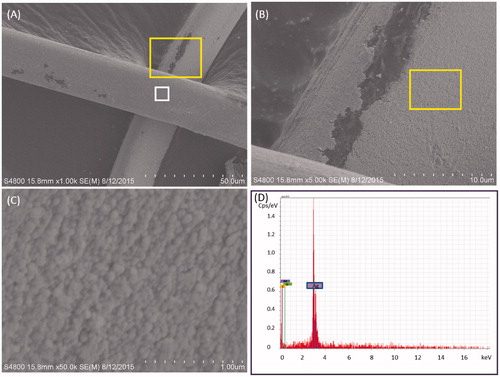
Table1. The summary of the SEM-EDX analysis of the SC samples after exposure to silver containing garment.
Figure 3. SEM image and silver elemental mapping from three spots on the SC tape no.15 of a healthy subject after wearing of silver garment. Two bright spots on the corneocyte surface (yellow squares in images A and D) correspond to the spots with high silver electron density in the elemental maps (yellow squares in images B and E) and were identified as silver in the EDX spectrum (C and F).
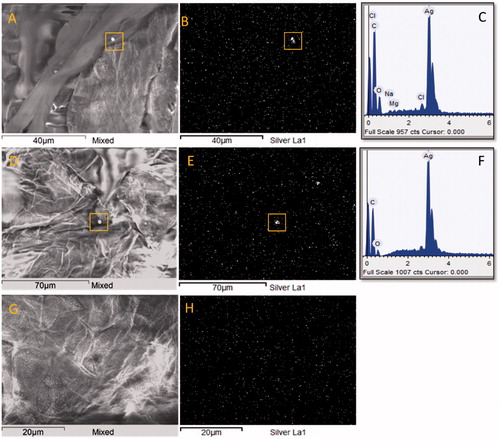
Figure 4. SEM image of SC tape no. 5 after wearing of silver garment. Micrometric aggregates with high electron density (white rectangles 1 and 2) on the corneocyte surface were identified as silver in the EDX spectrum (Spectrum 1 and 2). The EDX did not detect silver on the “black” spot (white rectangle 3) (Spectrum 3).
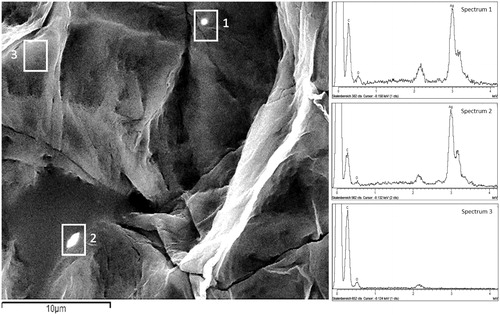
Figure 5. (A). SEM image of SC tape strip after wearing of silver garment. Micrometric aggregates on the corneocyte surface found on tape strip no. 5. (B): Corresponding EDX spectra of five bright spots (white rectangles) in the SEM image (A) showing different composition of the particles.
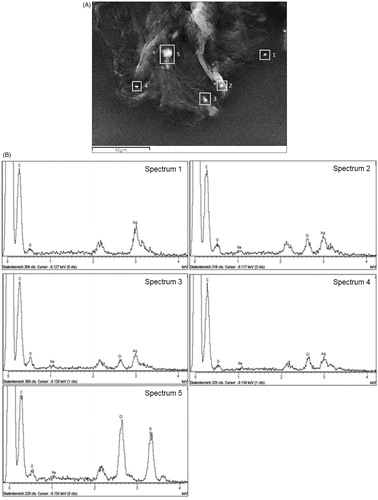
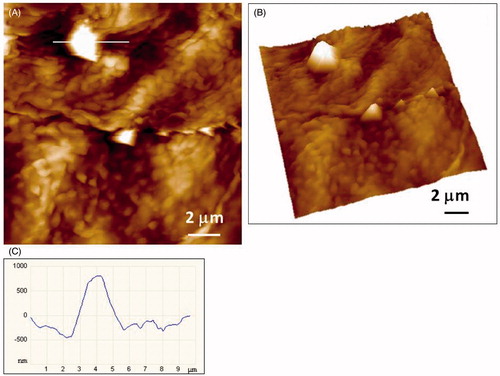
Figure 6. AFM imaging of the 15th SC tape of a healthy subject revealing cluster of nanoparticles: (A) height image with vertical scale of 400 nm; (B) 3D view of zoomed area (white box in A); (C) height image of zoomed area in A with height profile of the cluster along indicated line.
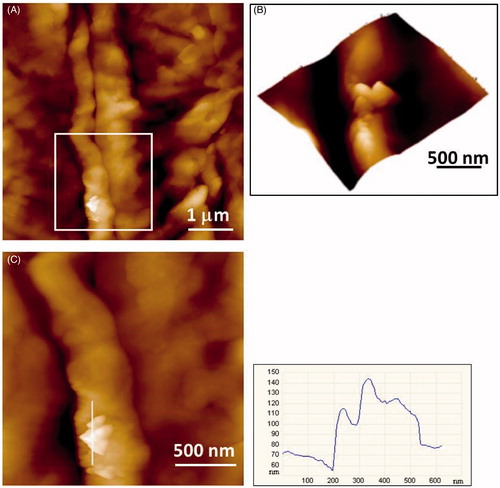
Figure 7. AFM imaging of the 12th SC tape of of an AD patient revealing particles of micrometric dimensions: (A) height image of the crystallites (vertical scale 1.2 mm); (B) 3D view; (C) height profile of the large crystallite along indicated line in A.