Figures & data
Figure 1. Scheme of the risk assessment process. In approach 1, the external human dietary intake (Part 1, described by Rompelberg et al., Citation2016) and the lowest NOAEL from toxicity studies (Part 3) are compared for the risk characterization (Part 5a). For approach 2, the external intake estimation and the NOAEL are extrapolated to internal doses (Parts 4a and 4b) using the toxicokinetic assessment and a kinetic model as illustrated in Parts 2a and 2b, resulting in a risk characterization based on internal concentrations (Part 5b).
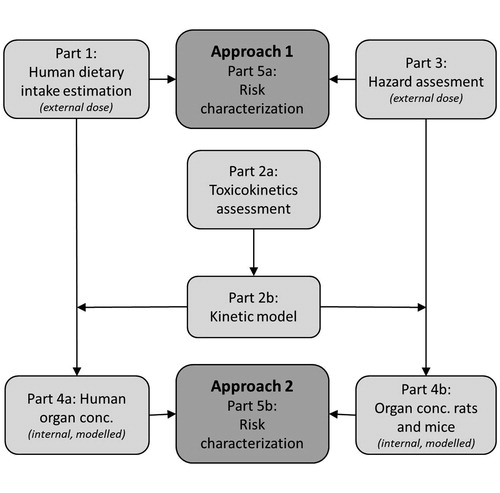
Figure 2. Scheme of the kinetic model for TiO2 NPs. The fraction Floss accounts for an apparent difference in the total amount of TiO2 recovered in blood and the sampled tissues and the total amount of TiO2 NPs administrated, which can be explained by a difference in nominal and actually administered dose, or loss of the NPs in e.g. tissues that were not sampled. P.O. = per oral, I.V. = intravenous, Fabs= fraction absorbed, kabs = kinetic rate of absorption, the kp’s are kinetic rates from the blood to the liver (l), spleen (s), gonads (g) or rest (r), or from liver to spleen (ls).
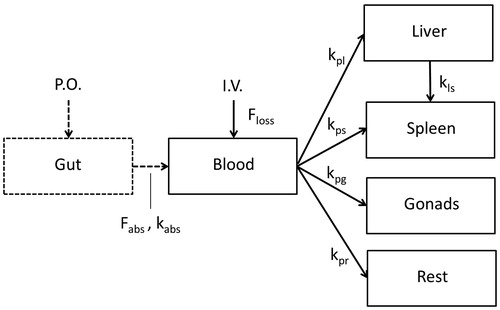
Figure 3. Result of model fit (line) to the measured kinetic data (symbols) in rats after 5 consecutive days of i.v. dosing of NM100 and subsequent follow-up until day 90 (data from Geraets et al. (Citation2014)). The amount of the element Ti found in the various organs is plotted on normal linear scale (A) or logarithmic scale (B). The red symbols and lines are the data and model fit in liver, the pink those in spleen, and the blue those in the “rest”.
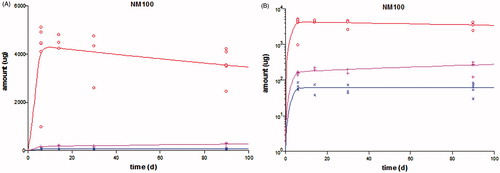
Table 1. Details of four key studies followed by one supportive study for the risk assessment of TiO2 NPs in food.
Table 2. Derived and acceptable margins of external exposure (MoEe) for the different effect levels found in the key studies, based on external doses. MoEes lower than the estimated acceptable MoEe are indicated in bold.
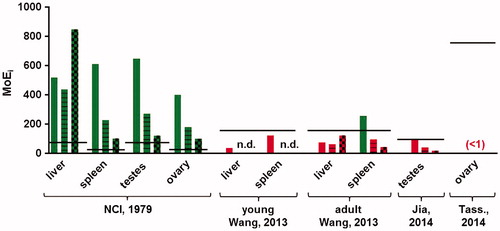
Figure 4. Margins of internal exposure (MoEis) between the organ concentrations resulting from food intake of the human population (P95) at 20 years (bars without pattern), 40 years (striped bars) and 80 years (bars with block pattern) and the organ concentrations at which effects were found in these organs in the animal studies referenced. The calculated MoEis for the study of Tassinari et al. (Citation2014) are below 1 and therefore not visible on the scale of the graph. The black lines show the estimated acceptable MoEi for that study, correcting for inter- and intraspecies differences, study duration and use of a LOAEL instead of a NOAEL, where applicable. Green bars indicate MoEis above the estimated acceptable MoEi (i.e. no risk anticipated), while red bars indicate MoEis lower than the estimated acceptable MoEi (i.e. a risk is possible).