
Figures & data
Figure 1. The method steps.

Table 1. Grouping of endpoints for the determination of the different biological effects.
Table 2. Criteria for the classification of the biological effects.
Figure 2. A typical Bayesian network showing the probabilistic relationship between a set of nodes.
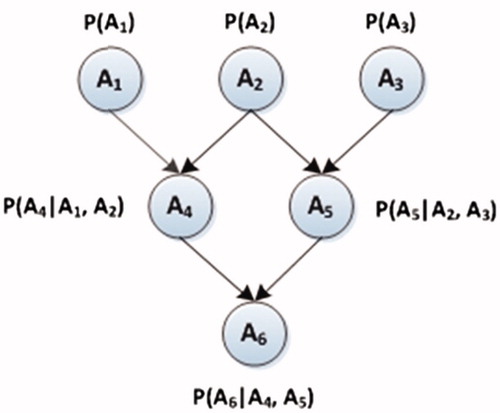
Figure 3. NM characteristics mentioned by national experts.
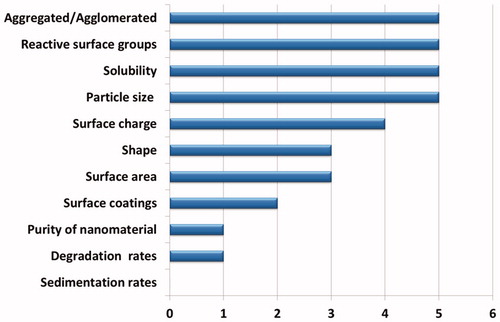
Figure 4. NM characteristics mentioned by international experts.
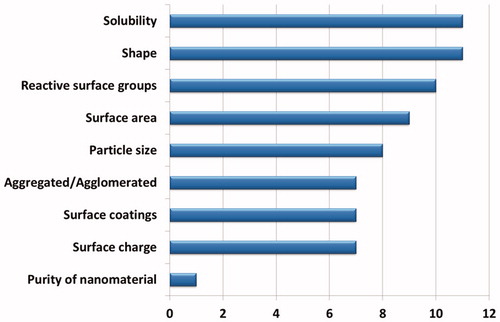
Figure 5. Distribution of answers to the question related to the states of node “Dissolution distribution”.
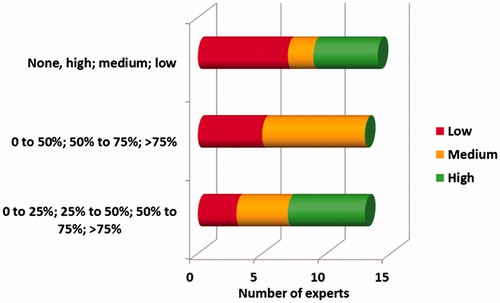
Figure 6. The BN structure containing state probabilities of each node, where the green ellipses are physicochemical properties of NM, orange ellipses are biological effects, yellow ellipses are additional nodes for administration routes and study type and finally ellipse is the NM hazard node. CNS: (Reaches) central nervous system.
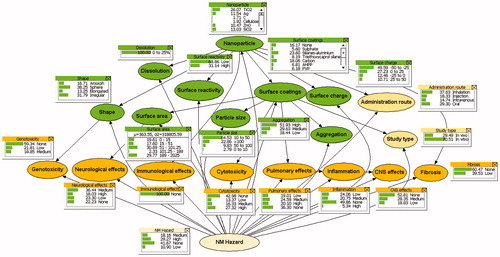
Table 3. Validation results of the BN; input values (20 cases).
Table 4. BN results; biological effects prediction.
Table 5. Sensitivity analysis showing the effect (entropy) of NM physiochemical properties on the NM hazard node and the nodes of biological effects.
Figure 7. The probability (%) of the hazard potential of NMs as predicted by the BN.
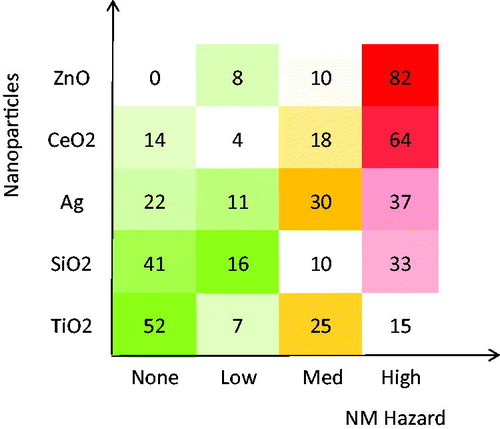
Figure 8. Effect of surface charge on the prediction of the high category level of hazard potential of NMs TiO2, SiO2, Ag, CeO2, ZnO. The figures give the probabilities in percentages.
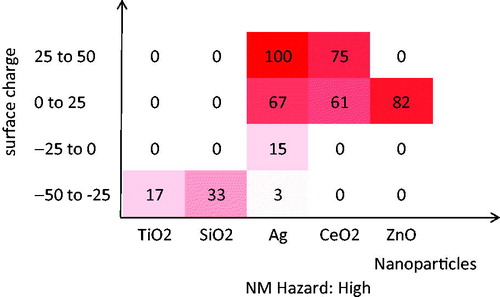
Table 6. The main NM physiochemical properties and the biological effects of 5 NMs (i.e., TiO2, SiO2, Ag, CeO2, ZnO) affecting NM hazard node.