
Figures & data
Figure 1. Body weight changes of Wistar rats treated with different compounds. Note that only rats treated with DOX had a decrease in body weight over time.
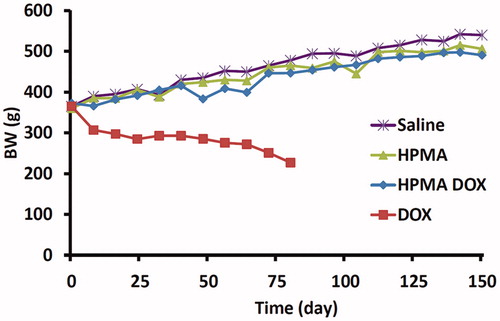
Figure 2. Organ toxicity induced by free DOX (HE stain). Upper micrographs show interstitial hemorrhage in the kidney (left) and fibrin amid deposits (right). Middle micrographs show areas of focal necrosis in the liver. Lower micrographs show pulmonary stasis (left) and hemorrhage (right).
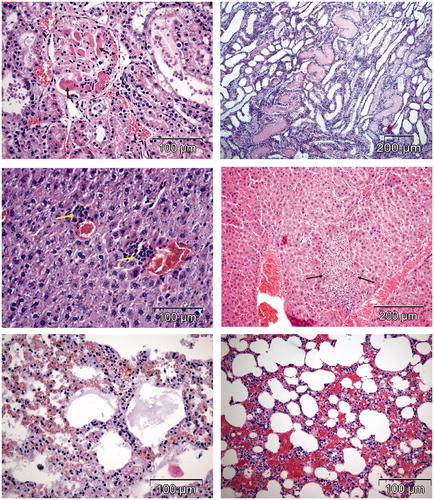
Figure 3. Histomorphological changes in the hearts of rats treated with DOX (HE stain). Rats treated with DOX had typical signs of cardiotoxicity: interstitial mononuclear infiltration, degeneration and diffuse necrosis of cardiomyocytes (upper left micrograph), loss of striation and interstitial hypercellularity (upper right micrograph); interstitial fibrosis (middle left micrograph) and vacuolar degeneration of cardiomyocytes (middle right micrograph). Lower micrographs illustrate expression of caspase 3 for detection of apoptosis in the heart tissue (insert shows lymphocytes).
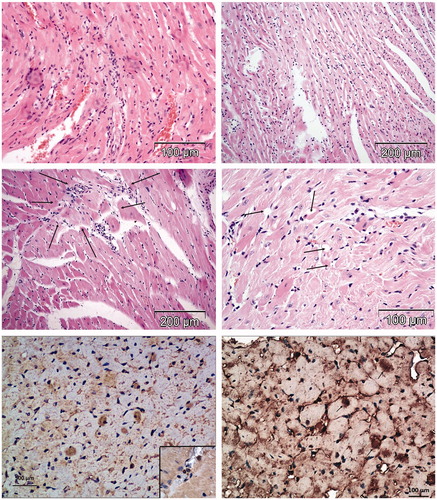
Figure 4. Survival of Wistar rats treated with different compounds. Note that only rats treated with free DOX exhibited low survival. Slightly and statistically insignificant lower survival of HPMA and HMPA–DOX rats in respect to SALINE treated rats was unrelated to treatment.
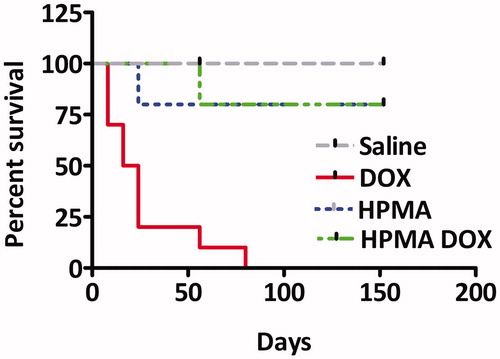
Figure 5. Histomorphological changes in the hearts of two rats treated with HPMA copolymer–DOX conjugate (HE and Masson’s Trichrome stain). Two rats treated with HPMA–DOX showed signs of cardiotoxicity: contraction band necrosis (upper left micrograph), diffuse interstitial infiltrate (lymphocytes and fibroblasts), focal necrosis (upper right micrograph), mild vacuolar degeneration of cardiomyocytes (left middle micrograph), loss of cross striation (middle right micrograph), vacuolar degeneration of cardyomyocites (lower micrograph on the left) and perivascular and interstitial fibrosis (right bottom micrograph Masson’s Trichrome staining).
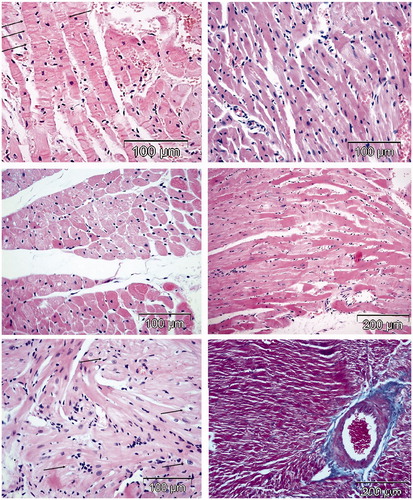
Figure 6. Histomorphological changes in the hearts of two rats treated with HPMA copolymer control (HE stain). Two rats treated with HPMA showed interstitial infiltration and hemorrhage (right micrograph). Left panel shows healthy myocardium in rats treated with saline.
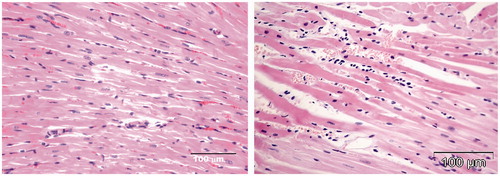
Figure 7. Echocardiography in one rat treated with DOX (right) and another with saline (left). B mode is shown at left and M mode at right. 0D indicates the day before treatment. Note that on day 56D and 77D, a rat treated with DOX exhibited increased left ventricular internal diameter in systole (LVIDs) and distole (LVIDd), enlarged posteror wall thickness (PW) and decreased interventricular septum thickness.
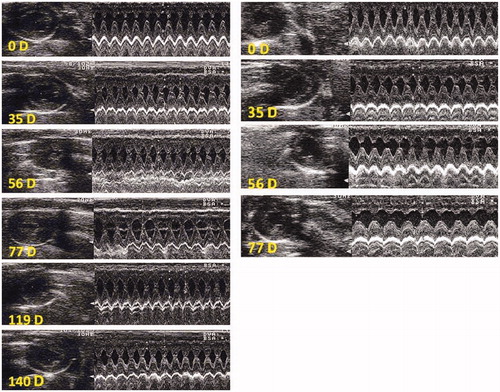
Figure 8. Echocardiography of one rat treated with HPMA copolymer (left) and another rat treated with HPMA copolymer–DOX conjugate (right). B mode is shown at left and M mode at right. Note an increase in left ventricular internal diameter in systole and diastole on day 140 (140D) in HPMA copolymer–DOX-treated rat (right bottom).
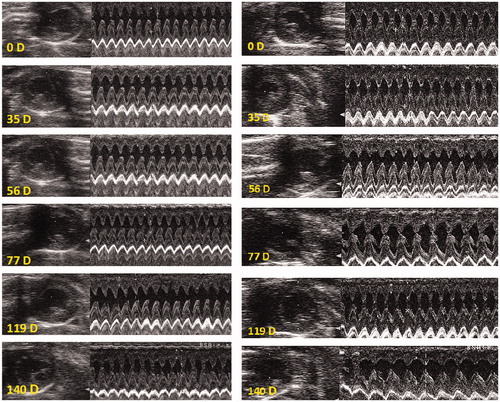
Table 1. Effects of different compounds on left ventricular end diastolic volume and ejection fraction.
Figure 9. Effects of different compounds on the components of HR short-term varaibility. Empty bars indicate saline-treated rats, light gray bars and dark gray bars indicate HPMA- and HPMA–DOX-treated rats, respectively. Black bars represent rats treated with DOX. NU on Y-axis stands for normalized units. Note a decrease in VLF and LF/HF in DOX-treated rats. Experiments are mean of atleast six experiments ± SEM. ‡p < 0.05 vs. day 0; *p < 0.05 vs. saline; †p < 0.05 vs. HPMA; ¶p < 0.05 vs. DOX.
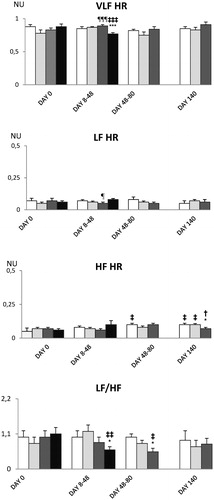
Figure 10. A typical HR spectrum of one rat before and after treatment with DOX. Note a decrease of spectral power in lower frequencies (VLF and LF) 16 days after treatment by DOX.
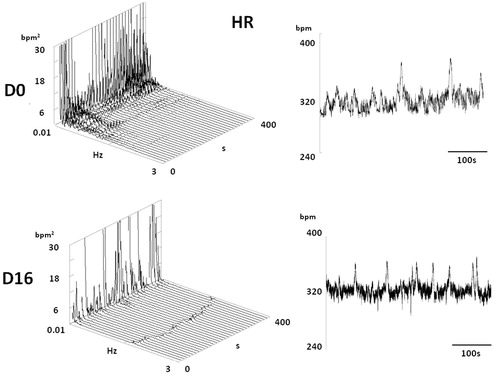
Figure 11. Effects of different compounds on the components of BP short-term variability. Empty bars indicate saline-treated rats, light gray bars and dark gray bars indicate HPMA- and HPMA–DOX-treated rats, respectively. Black bars represent rats treated with DOX. NU on Y-axis stands for normalized units. Note redistribution of spectral power towards HF in DOX-treated rats. Experiments are mean of atleast six experiments ± SEM. ‡p < 0.05 vs. day 0; *p < 0.05 vs. saline; †p < 0.05 vs. HPMA; ¶p < 0.05 vs. DOX.
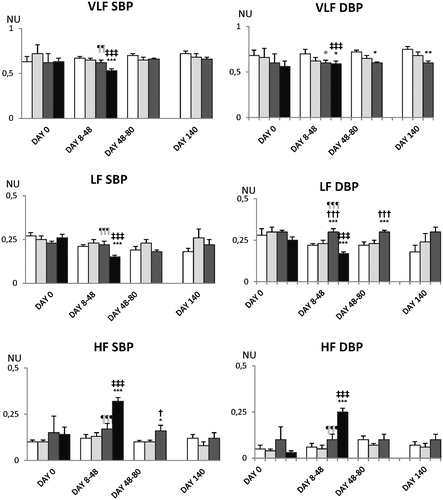
Figure 12. A typical SBP spectrum of one rat before and after treatment with DOX. Note a decrease of spectral power in lower frequencies (VLF and LF) in rats 16 days after treatment by DOX.
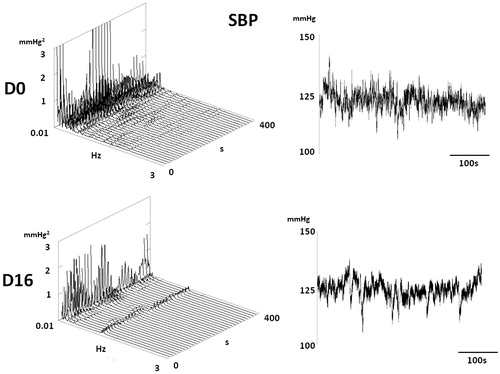
Table 2. Effects of different compounds on heart rate and arterial blood pressure.