Figures & data
Figure 1. Schematic representation of the tNG and their building blocks.
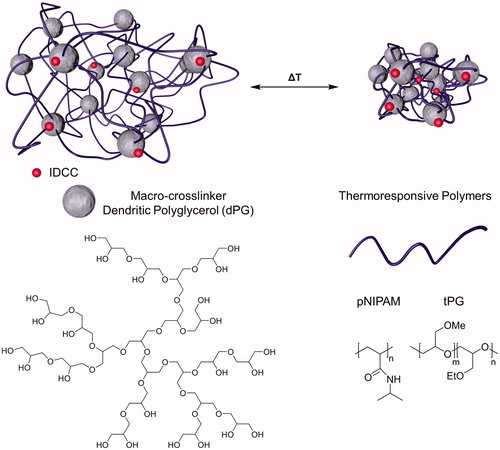
Figure 2. Characterization of tNGs. Normalized transmission of the tNG aqueous solutions as a function of temperature UV-Vis (λ = 500 nm).
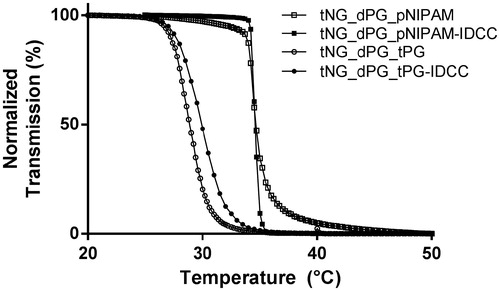
Table 1. The synthesized nanogels and their properties.
Figure 3. (A) DX and (B) TAC loading capacity of studied tNGs as assessed by isotope-dilution LC-MS/MS. Hereby, the drug concentrations in aqueous tNG solutions of defined polymer concentrations (5 mg/mL) as well as the resulting percentage drug loading contents are given. For comparison, concentrations of tNG-free, saturated aqueous drug solutions are presented. Data are means ± SEM from three separately prepared tNG batches (each measured thrice) or saturated aqueous drug solutions.
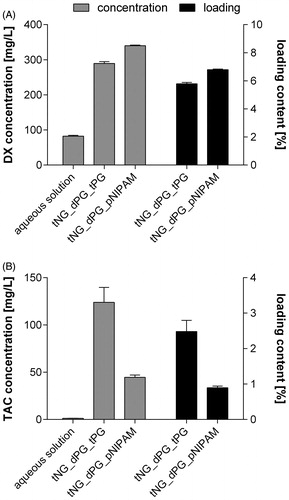
Figure 4. Cellular uptake of tNGs by primary keratinocytes. NHK were exposed to 0.2 mg/mL of each tNG for 24 h. Colocalization between tNG_dPG_pNIPAM-IDCC (A, B) or tNG_dPG_tPG-IDCC (C, D) (IDCC signal pseudo-colored red) and lysosomal compartment (Lysotracker® Red staining, pseudo-colored green)s was then assessed by CLSM. Cell nuclei were counterstained with DAPI (pseudo-colored blue). Scale bars represent 25 μm.
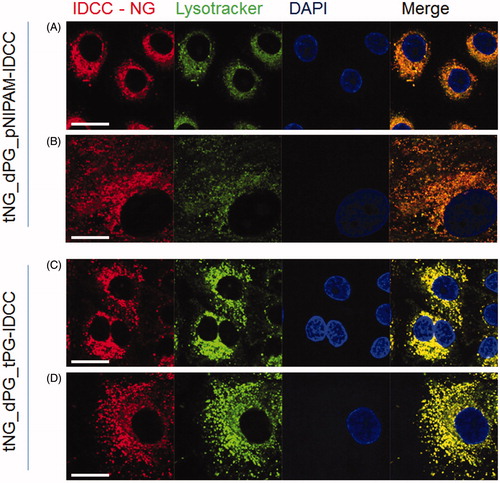
Figure 5. Effect of tNGs on cell viability, intracellular ROS and genotoxicity. NHK were exposed to the indicated tNG concentrations for (A) 24 h or (B) 48 h. A declined formazan formation <75% after MTT exposure indicates cytotoxicity. (C, D) ROS were measured via the Carboxy-H2DCFDA assay and FACS analysis. Cells were incubated with the indicated concentrations (0.05 and 0.5 mg/mL) of tNG_dPG_tPG (C) and tNG_dPG_pNIPAM (D) for a period of 24 h at the indicated time points. Exposure to 5 μg/mL silver nanoparticles served as a positive control. (E) Measurement of DNA damage using the alkaline comet assay. Cells were treated with the indicated tNG concentrations for 24 h. Exposure to 5 μg/mL silver nanoparticles for 24 h served as a positive control. After 24 h, the level of DNA breakage was expressed by the relative tail length. Values are expressed relative to untreated keratinocytes which served for reference (black dotted line). Statistical differences were assessed by one-way ANOVA and Bonferroni’s post analyses (mean ± SEM; n = 3). **p < 0.01 indicates a statistically significant difference compared with control cells.
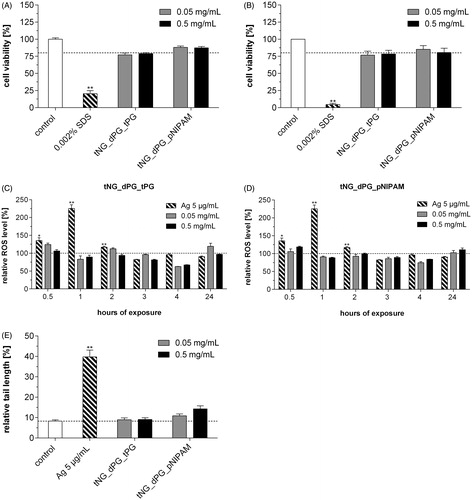
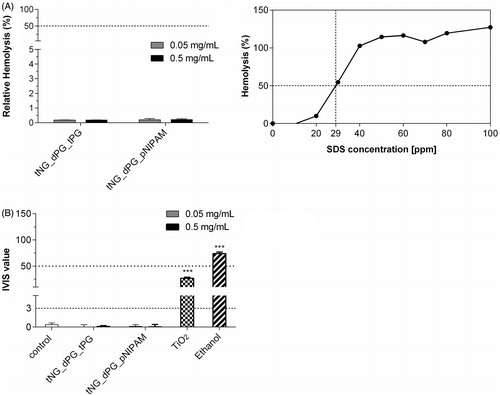
Figure 6. Eye irritation potential of tNGs (A) NHK were exposed to the indicated concentrations of tNGs. Then, irritation potential was assessed with RBC test. Negligible hemolysis (%) far under the irritation cutout of 50% by nanogels after 10 min exposure indicates no in vivo eye irritation potential. Mean ± SEM (n = 3). (B) Opacity increase and permeability decrease of bovine corneas after incubation with 0.05 and 0.5 mg/mL tNGs as assessed by BCOP test. The final in vitro irritancy score (IVIS) is depicted as mean ± SEM. (n = 3). IVIS values are classified into “No Category” (≤3), as defined by the United Nations Globally Harmonized System of Classification and Labelling of Chemicals (UN GHS). Statistical differences were assessed by one-way ANOVA and Bonferroni’s post analyses.