Figures & data
Figure 1. Scanning electron micrographs showing the surface morphology of (A) uncoated Ti6Al4V control discs (3.0k), (B) Ti6Al4V discs coated with nHA (×4.5k), (C) Ti6Al4V discs coated with mHA (×1.0k), (D) anodised Ti6Al4V discs (×3.0k), (E) anodised Ti6Al4V discs coated with nHA (×5.0k), (F) anodised Ti6Al4V discs coated with mHA (×1.0k), (G) Ti6Al4V discs coated with nano-silver (×3.0k), (H) Ti6Al4V discs coated with nano-silver and nHA (×2.0k) and (I) Ti6Al4V discs coated with nano-silver and mHA (×1.0k). Additional SEM images shown in the top right corners demonstrate details of the surface nanotopography at higher magnification. The EDS spectra show the elemental composition of the uncoated, anodised and silver plated disc surfaces.
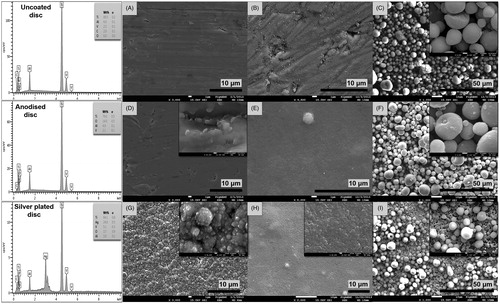
Figure 2. Example three-dimensional images showing the surface roughness and surface nanotopography of (A) uncoated control discs, (B) discs coated with nHA, (C) discs coated with mHA, (D) anodised discs, (E) anodised discs coated with nHA, (F) anodised discs coated with mHA, (G) silver plated discs, (H) silver plated discs coated with nHA and (I) silver plated discs coated with mHA. Images were acquired by an Olympus LEXT OLS 3000 confocal laser scanning microscope equipped with a 408 nm LD class 2 laser (magnification: 50×; optical zoom: 1×).
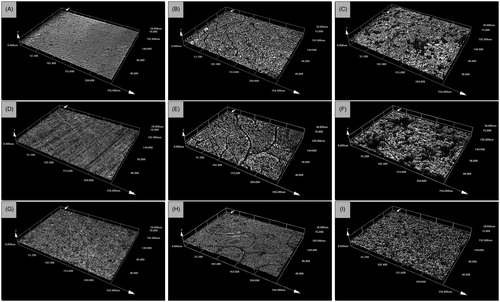
Table 1. Surface roughness values of the uncoated controls and coated test discs.
Table 2. Total silver, titanium, phosphorous and calcium concentrations in the media indicating the extent of material loss from the discs and the nanocoatings due to dissolution or degradation.
Figure 3. (A) Bacterial growth of S. sanguinis in suspension, measured as absorbance values of the inoculated physiological saline-BHI media recorded after a 24 h exposure to the test Ti6Al4V discs compared to the uncoated discs (Ti) and blanks (no disc), (B) the absorbance values recorded for each test group after 16 h of incubation were compared to the mean value of the uncoated controls (equated to 100% of bacterial adhesion) to give a relative measurement of bacterial adhesion, (C) percentage of live S. sanguinis after a 24 h exposure to coated Ti6Al4V discs compared to uncoated controls and blanks, (D) percentage of live S. sanguinis after incubation of the bacteria, previously adhered to the different test coatings, in fresh BHI media for 16 h, (E) total lactate production of S. sanguinis after a 24 h exposure to coated Ti6Al4V discs compared to uncoated controls and blanks, (F) total lactate produced by S. sanguinis after incubation of the bacteria, previously adhered to the different test coatings, in fresh BHI media for 16 h. Different letters indicate significant differences between the test groups (one-way ANOVA, p < 0.05). Note that the axis units in panels A and B are different.
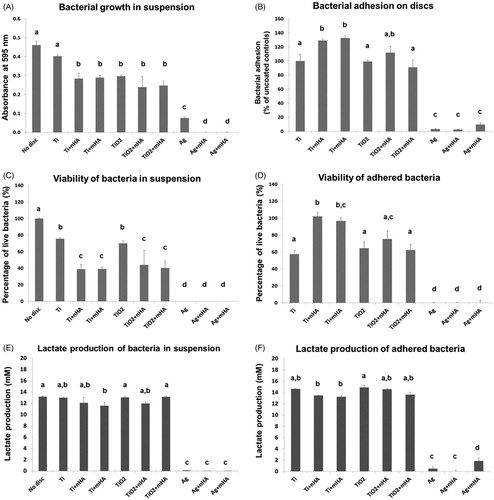
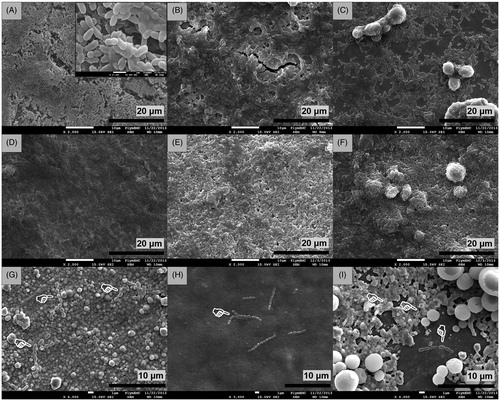
Figure 4. Scanning electron micrographs of Ti6Al4V discs after 24 h of incubation in inoculated media showing (A) formation of S. sanguinis biofilm on uncoated control discs (×2.0k), (B) biofilm formation on discs coated with nHA (×2.0k), (C) biofilm formation on discs coated with mHA (×2.0k), (D) biofilm development on anodised discs (×2.0k), (E) biofilm development on anodised discs coated with nHA (×2.0k), (F) biofilm development on anodised discs coated with mHA (×2.0k), (G) biofilm inhibition on silver plated discs (×4.0k), (H) biofilm inhibition on silver plated discs coated with nHA (×3.0k) and (I) biofilm inhibition on silver plated discs coated with mHA (×4.0k). White pointers indicate the locations of limited bacteria found adhered on the surfaces of silver plated groups.