Figures & data
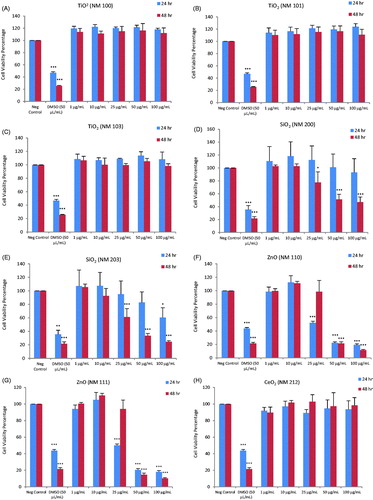
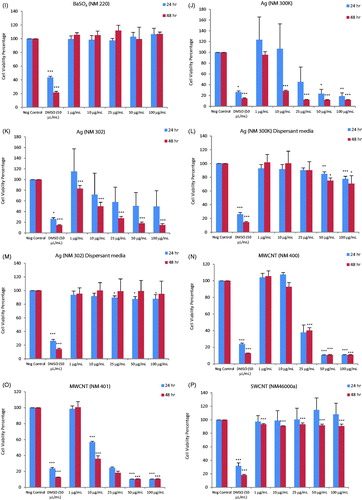
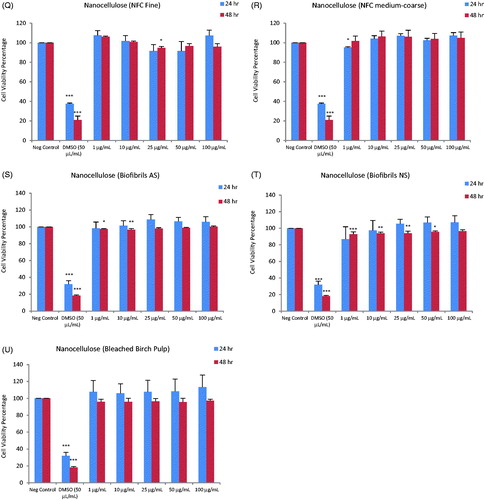
Figure 2. Heatmap of IC50 values for a panel of nanomaterials. Based on IC50 values calculated from the data shown in Figure 1, the ZnO NPs (NM110 and NM111), nano-Ag (NM300K and NM302) and MWCNTs (NM400 and NM401) showed the highest cytotoxicity among the tested ENMs following exposure of macrophage-differentiated THP.1 cells.
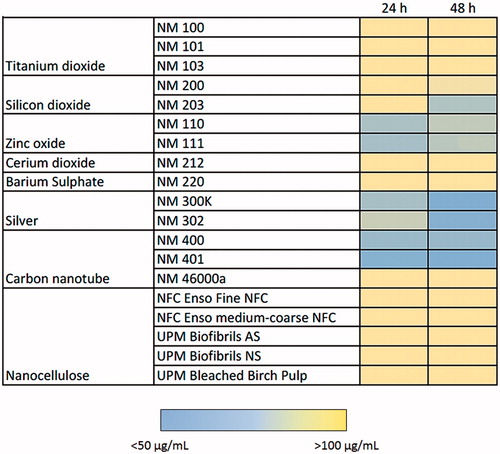


Figure 4. Hierarchical cluster analysis of cytokine profiling data. The heatmaps show the hierarchical cluster analysis of cytokine, chemokine and growth factor secretion by human macrophage-like THP.1 cells exposed to (A) 10 and (B) 25 µg/mL of the indicated ENMs. Complete linkage and Euclidean distances were employed as metrics to draw association dendrograms between cytokines and ENMs. Each branch in the dendrograms shows the similarity between samples; the shorter the branch, the more similar are the samples. Association clusters for ENMs and cytokines are represented by dendrograms at the left and at the top of each heatmap, respectively.
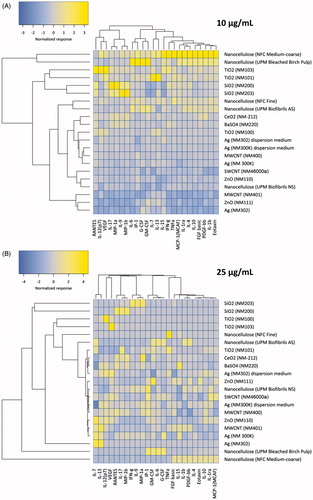
Figure 5. Pathway analysis of cytokine profiling data. Pathway analysis results using the IPA software tool integrating the normalized cytokine, chemokine and growth factor expression levels in human macrophage-like THP.1 cells exposed to (A) 10 and (B) 25 µg/mL of the indicated ENMs were transformed into interpolated networks, highlighting the grouping of ENMs into activators and deactivators of nuclear receptor (PPAR and LXR/RXR) pathways, respectively. Heatmaps show significant canonical pathways (Z > 2, adjusted p < .05 for at least one activated pathway per treatment).
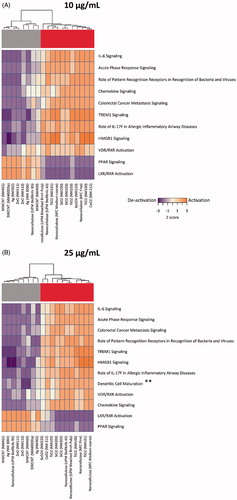
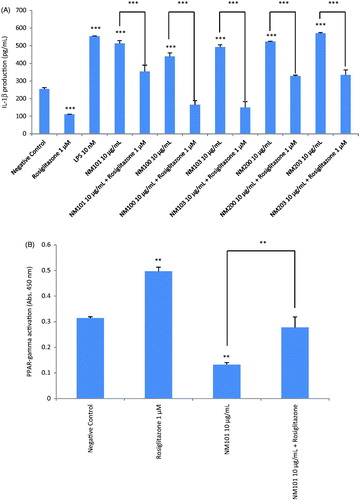
Figure 6. Role of PPAR-γ for cytokine responses. (A) IL-1β release from macrophage-differentiated THP.1 cells was analyzed after exposure for 24 h to TiO2 (NM101), TiO2 (NM100), TiO2 (NM103), SiO2 (NM200) and SiO2 (NM203) in the presence or absence of the PPAR-γ agonist, rosiglitazone (1 µM). (B) PPAR-γ activity was tested by analyzing specific peroxisome proliferator response element (PPRE) binding activity in nuclear extracts of exposed cells. Exposure of macrophage-differentiated THP.1 cells to TiO2 (NM101) for 24 h significantly reduced the activation of PPAR-γ while co-exposure to rosiglitazone (1 µM) reversed this effect. Data shown are mean values ± SD (n = 2). ***p ≤ .001 and **p ≤ .01 by one-way ANOVA followed by Tukey’s post-hoc test.