Figures & data
Figure 1. Schematic of direct fluorescence labeling of CB and CC particles in a single-pass aerosol configuration. Aerosol-produced CB (spark ablation) and CC (bubble bursting) particles are directly incorporated with FITC-NH2PEGCOOH droplets (collison atomizer) and subsequently injected into a UV irradiation diffusion dryer for dynamic stiffening of FITC-NH2PEGCOOH on particle surfaces. The “labeled particles” are compared with untreated CB and CC particles by cytotoxicity assays and cellular uptake analyses.
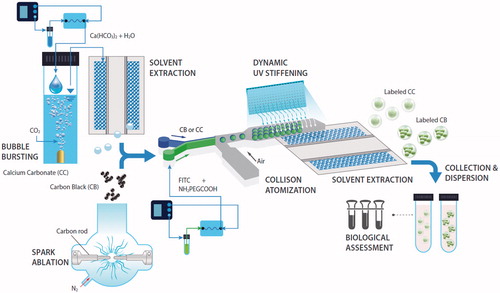
Figure 2. Particle size distributions of a untreated and labeled CB particles and b untreated and labeled CC particles, including collison atomized-dried FITC-NH2PEGCOOH or “labeling probe.” Size distributions were measured using SMPS, which consisted of a differential mobility analyzer, condensation particle counter, and aerosol charge neutralizer.
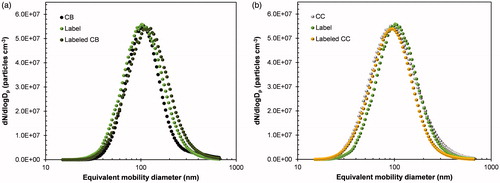
Figure 3. Low- and high-magnification TEM images of untreated CB, labeled CB, untreated CC, and labeled CC particles including individual labeling probes. Specimens are prepared by direct aerosol deposition of particles on carbon-coated copper grids.
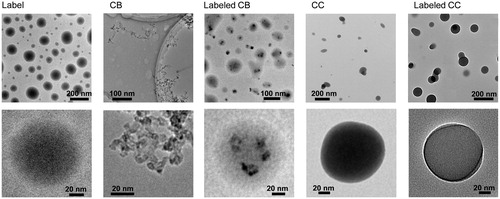
Figure 4. Bioactivities of untreated CB, labeled CB, untreated CC, and labeled CC particles on A549 cells. (a) Cytotoxicities, (b) LDH activities, (c) intracellular ROS, and (d) caspase-3 activities of A549 cells treated with the different particles. All assays are conducted in a concentration-dependent manner, and activities increased with particle concentration. All experiments were performed in triplicate (n = 3), and the results were reported as average values and standard deviations. The p values of untreated CB, labeled CB, untreated CC, and labeled CC particles are 0.0364, 0.0411, 0.0289, and 0.0371, respectively. The results are shown as p < 0.05 was regarded as statistically significant compared to the untreated control.
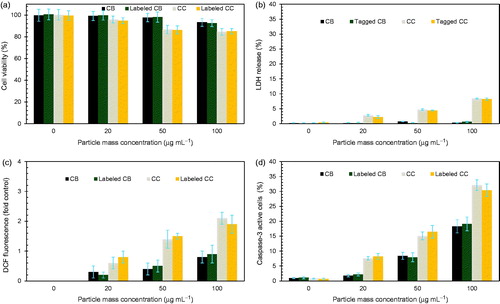
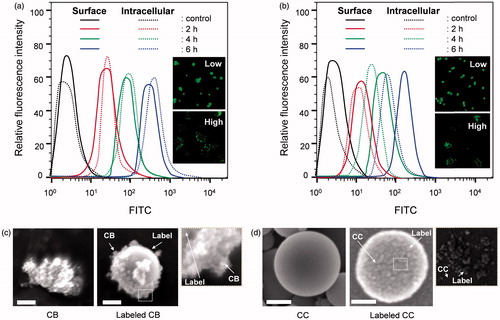
Figure 5. Flow cytometric analyses of intracellular uptake of (a) labeled CB and (b) CC particles. Insets of both images show low- and high-magnification confocal micrographs of A549 cells with localized labeled particles. FITC labels facilitated the measurement of particle uptake and visualization of localized particles. Apparent morphologies of (c) untreated and labeled CB, and (d) untreated and labeled CC particles are shown as well, and the original shapes of CB and CC particles remain nearly the same after fluorescent labeling. Scale bars (c, d), 50 nm.