
Figures & data
Figure 1. TEM characterization of M-MSNs. (A) As the pristine state, (B) covered with PEG, and (C) cryogenic TEM characterization of lipid bilayer DMPC M-MSNs.
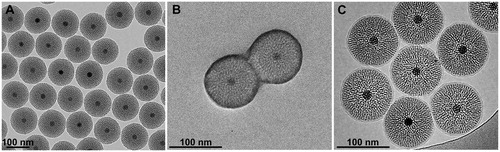
Table 1. Physicochemical characterization of pristine M-MSNs and those covered with PEG or DMPC lipid bilayer.
Figure 2. MTT cell viability assay of HepaRG cells exposed for 48 h to increase concentrations of pristine M-MSNs (blue curve), PEG M-MSNs (purple curve), DMPC M-MSNs (red curve), and chlorpromazine as the positive control (grey curve). Concentration equivalences: * = 1.6 µg/cm², ** = 16 µg/cm², and *** = 80 µg/cm². Results are expressed as mean percent viable cells ± SD (n = 3) compared with control cells.
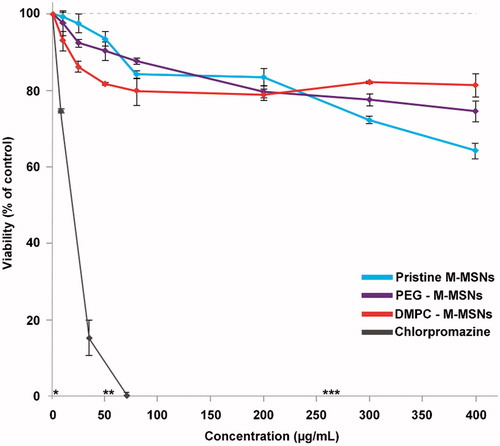
Figure 3. Real-time impedance cell index (CI) monitoring of HepaRG cells (n = 3) exposed to (A) 16 µg/cm² and (B) 80 µg/cm² pristine M-MSNs (blue), PEG M-MSNs (purple), and DMPC M-MSNs (red) for 72 h. The black arrow represents the starting point of exposure. CI was normalized at this point to ensure inter-dose comparison and control cells were defined as baseline.
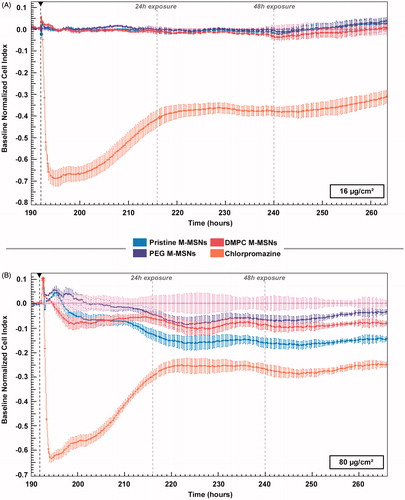
Figure 4. TEM imaging of HepaRG cells exposed to 16 µg/cm² for 6 h to (A) pristine M-MSNs, (B) PEG M-MSNs, (C) DMPC M-MSNs, and for 24 h to (D) pristine M-MSNs, (E) PEG M-MSNs, (F) DMPC M-MSNs. N indicates the nucleus, BC indicates bile canaliculi, and arrows indicate NPs.
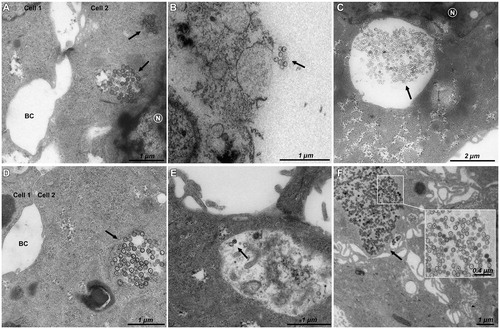
Figure 5. Time- and dose-dependent effects of exposure to NPs on the number of significantly differentially expressed genes. HepaRG cells were exposed to 1.6, 16, and 80 µg/cm² pristine, PEG-, and DMPC-coated M-MSNs for 24 or 48 h. After extraction and labeling, RNA was hybridized to a human oligo microarray (6 × 60 k Agilent V3 SurePrint). Bars represent the number of differentially expressed transcripts after statistical analysis using Genespring GX13 software (Agilent), with a p value ≤0.05 and a fold-change ≥2.
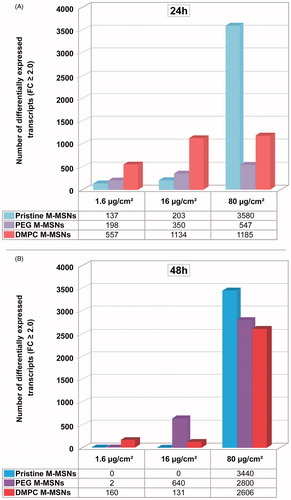
Figure 6. Canonical pathways elicited by each M-MSN (80 µg/cm²). The percentage of modulated transcripts of our datasets belonging to six major altered canonical pathways after (A) 24 h and (B) 48 h exposure to 80 µg/cm² M-MSNs. These pathways were all significant according to a Fisher’s statistical test (p value <0.05), revealed with Ingenuity Pathway Analysis (IPA, QIAGEN).
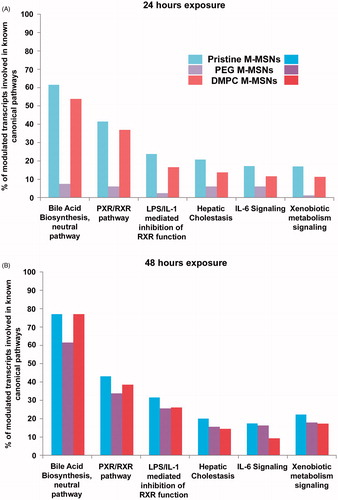
Figure 7. Representation of M-MSN mode of action on HepaRG hepatocytes. HepaRG cultures (n = 3) were exposed for 24 and 48 h to three concentrations (1.6, 16, and 80 µg/cm²) of NPs including pristine (blue dot), PEG- (purple dot) and DMPC- (red dot)coated M-MSNs. N = nucleus. At 80 µg/cm², the hepatic cholestasis pathway is highlighted by the downregulation of most of its main effectors such as BSEP and NCTP, characterized by an intrahepatic accumulation of cytotoxic bile acids, which ultimately causes liver injury.
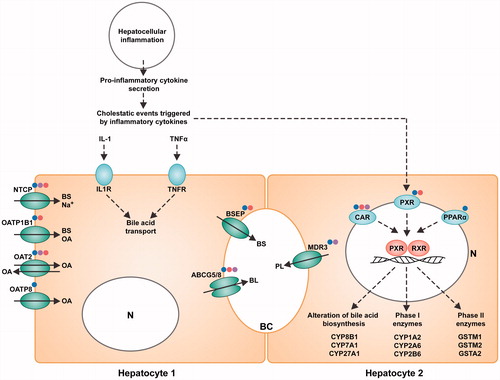
Table 2. Fold changes (FC) of main transcripts modulated by exposure to pristine, PEG, and DMPC M-MSNs (80 µg/cm2 at 24 and 48 h) corresponding to hepatobiliary system disruption.