
Figures & data
Table 1. Experimentally determined physicochemical properties.
Figure 1. Confusion matrix describing the performance of a classification model (or ‘classifier’) on a set of test data for which the true values are known.
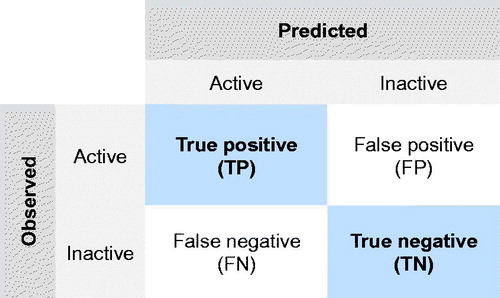
Table 2. Nanomaterial surface coatings.
Table 3. Summary of the nanomaterial intrinsic oxidative potential, protein carbonylation, and NOAECs derived from short-term inhalation studies (STIS).
Table 4. Activity in protein carbonylation assay.
Figure 2. Classification tree for the protein carbonylation assay. Active nanomaterials are indicated with red; inactive with green color. Please note that the classification tree uses the auto scaled values of the descriptors. Thus, size≥ −0.41 corresponds to 12.5 nm and SSA≥ −1.4 corresponds to 47.9 m2/g.
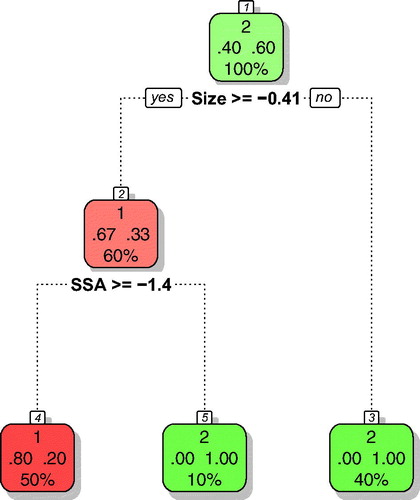
Table 5. Validation of the model robustness (protein carbonylation assay).
Table 6. Original and consensus fuzzy predictions of protein carbonylation for untested nanomaterials.
Figure 3. Classification tree for nanomaterial intrinsic oxidative potential. Active nanomaterials are indicated with red; inactive with green color. Please note that the classification tree uses the auto scaled values of the descriptors. Thus, size≥ −0.41 corresponds to 23.83 nm.
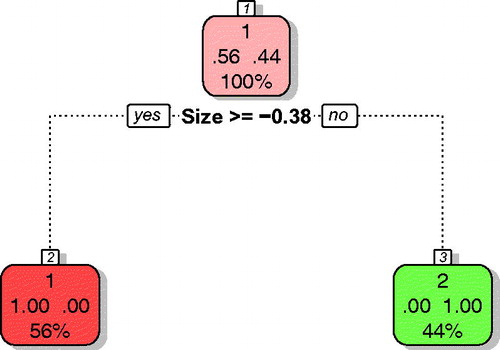
Table 7. Nanomaterial intrinsic oxidative potential.
Table 8. Validation of model robustness (nanomaterial intrinsic oxidative potential).
Table 9. Original and consensus fuzzy predictions of nanomaterial intrinsic oxidative potential for untested nanomaterials.
Figure 4. Classification tree for a short-term inhalation study in rats. Active nanomaterials are indicated with red; inactive with green color. Please note that the classification tree uses the auto scaled values of the descriptors. Thus, LUMO_C< −0.61 corresponds to −2.40 eV; SSA ≥0.99 corresponds to 158.48 m2/g, and Shelpres <0.05 to the value of 0.5.
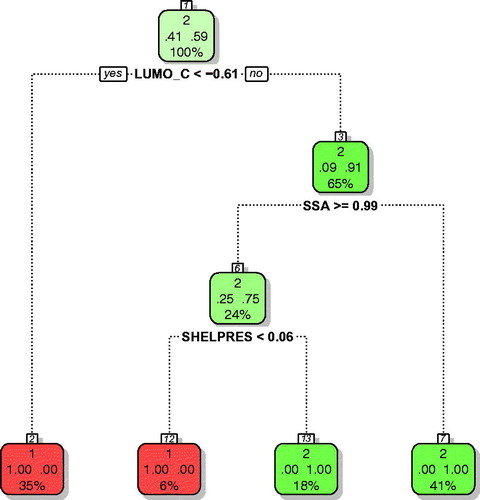
Table 10. Activity in a short-term inhalation study in rats.
Table 11. Validation of model robustness (a short-term inhalation study in rats).
Table 12. Original and consensus fuzzy predictions of activity in a short-term inhalation study in rats for untested nanomaterials.