Figures & data
Figure 1. Schematic illustration of rhodamine B labeled dendritic polyglycerol (dPG-RB), dPG sulfate (dPGS-RB), and dPG amine (dPGNH2-RB). Counter ions are not shown for clarity reasons.
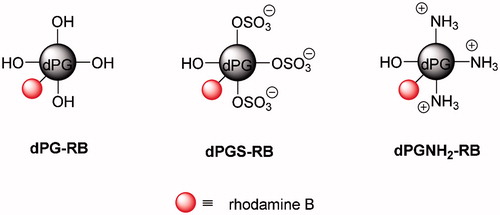
Table 1. Characterization of rhodamine B labeled dPG nanoparticles.
Figure 2. Localization of differently charged (neutral (Neu; A,B), negative (Neg; C–F), positive (Pos; G–L)), labeled dPG-NPs (pink) in exposed primary cytotrophoblasts (A–D,G,H), and BeWo cells (B,E,F,I–L). Exposure concentrations: 1 µM (A–J) and 10 nM (K,L)), exposure time: 6 h (C,E,G,I,K), and 24 h (A,B,D,F,H,J,L). Nuclear staining: DAPI (blue). Confocal images, 400x. Patchy perinuclear and nuclear localization was seen after 6 h of exposure to 1 µM neg. dPG-NPs (C,E) and pos. dPG-NPs (G,I), increasing after 24 h. Notably, in BeWo cells pos. dPG-NP deposits were also detected after exposing them to a 10 nM concentration for 6 h (K) and 24 h (L). No neutral dPG-NP deposits were detected in both cell types (A,B).
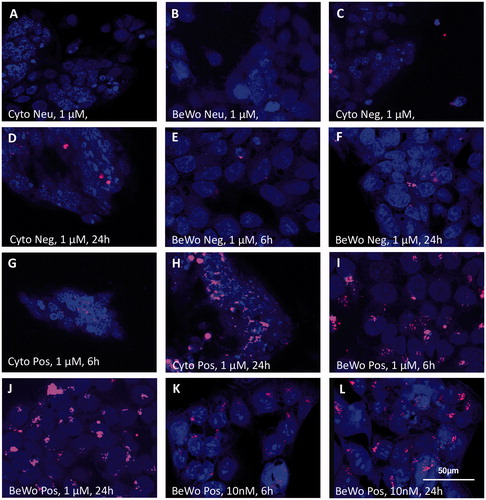
Figure 3. Localization of differently charged (neutral (Neu; C), negative (Neg; A,D), positive (Pos; B, E–F)), labeled dPG-NPs (orange), in exposed placental explants. Exposure concentration: 1 µM, exposure-time: 6 h (A,B) and 24 h (C–F). Nuclear staining: DAPI (blue). Fluorescence microscopy images, 200× (A,B), 1000× (C–F). Local staining of cytoplasm and nuclei in syncytiotrophoblast (ST, arrows) was detected after 6 h of exposure to neg. and pos. dPG-NPs (A,B), increasing after 24 h. Notably, pos. dPG-NP deposits, were localized at the basal membrane (thin arrows, F) close to the cytotrophoblast cell layer (CT) and in some cells of mesenchymal core (short arrowheads) (E,F). No signal was observed for neu. dPG-NPs (C).
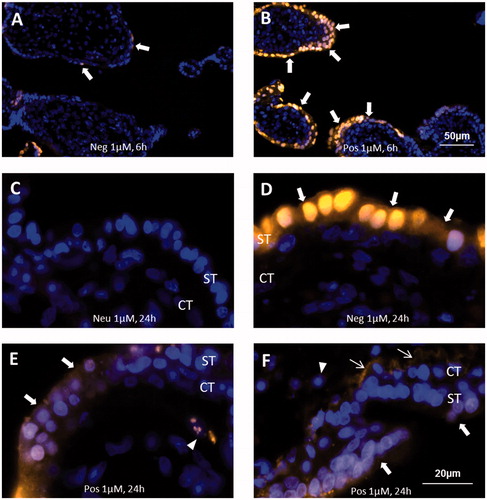
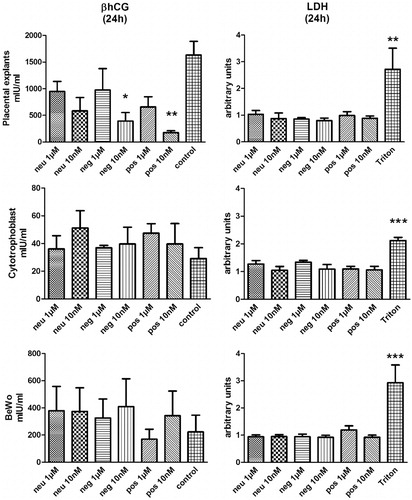
Figure 4. LDH- and hCG-levels in culture supernatants of placental explants, BeWo cells, and primary cytotrophoblast cells, exposed to neutral (Neu), positively (Pos), and negatively charged (Neg) dPG-NPs for 24 h, at concentrations of 1 µM and 10 nM and to 1% Triton®X100. LDH data are shown in relative units as ratio to control values, while hCG data are presented in mU mL−1. *(p < 0.05), **(p < 0.01), and ***(p < 0.001) indicate statistically significant differences.