Figures & data
Figure 1. Characterization of SiNPs by AFM. (A) AFM height profile of SiNPs. (B) 2D peak-force error AFM scans of SiNPs. (C) 3D height image of SiNPs.
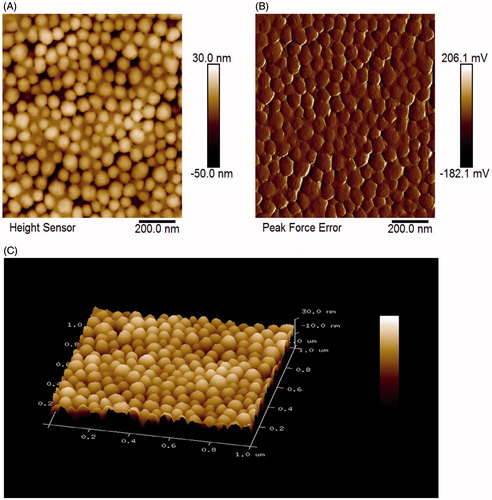
Figure 2. Characterization of SiNPs. (A) TEM of SiNPs. Scale bar, 0.2 μm. (B) Hydrodynamic sizes of SiNPs. (C) Zeta potential of SiNPs.
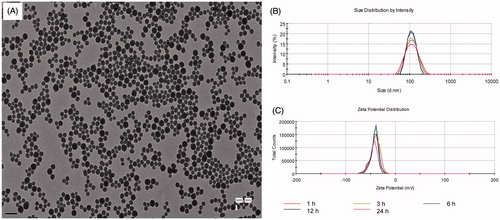
Figure 3. Ultrastructural observation and cytoskeleton structure in SiNPs-treated HUVECs. (A,C) Control group, (B,D) 50 μg/mL treated group. Yellow arrow: swollen mitochondria; red arrow: SiNPs; green arrow: autophagosome. Scale bar of TEM: (A) and (B) for 1 μm; (a) and (b) for 0.2 μm. For LSCM: F-actin (green); DAPI (blue); SiNPs (red) with white arrow.
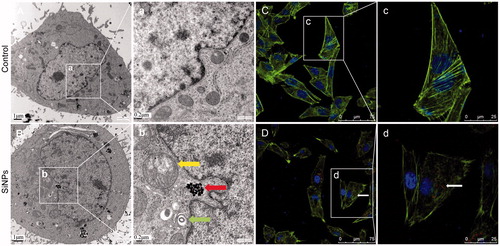
Figure 4. Effects of SiNPs on proinflammatory and procoagulant cytokines in HUVECs. (A) IL-6; (B) IL-8; (C) MCP-1; (D) PECAM-1; (E) TF; (F) vWF. Data are expressed as mean ± standard deviation from three independent experiments (*p < 0.05).
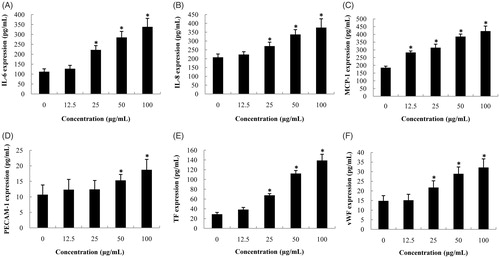
Figure 5. Inflammatory response and vascular endothelial cell dysfunction induced by SiNPs. (A,B) SiNPs increased the recruitment and chemotaxis of neutrophils in caudal vein of Tg(mpo:GFP) zebrafish. (C,D) SiNPs inhibited the expression of vascular endothelial cells in Tg(fli-1:EGFP) zebrafish. n = 30, data are expressed as mean ± standard deviation from three independent experiments (*p < 0.05). Scale bar: 100 μm.
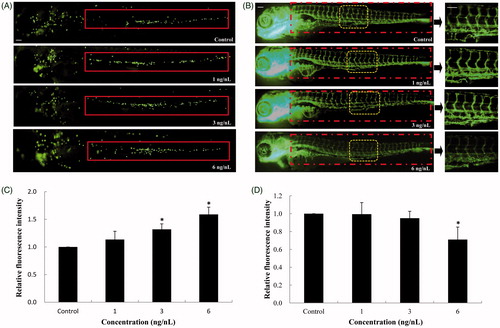
Figure 6. Hemodynamics changes and thrombus formation induced by SiNPs. (A,B) Blood flow and blood velocity were significantly decreased compared to that of control. (C,D) Erythrocytes aggregation in the caudal vein, markedly increasing the incidence of thrombosis in SiNPs-treated groups. n = 30, data are expressed as mean ± standard deviation from three independent experiments (*p < 0.05). Scale bar: 100 μm.
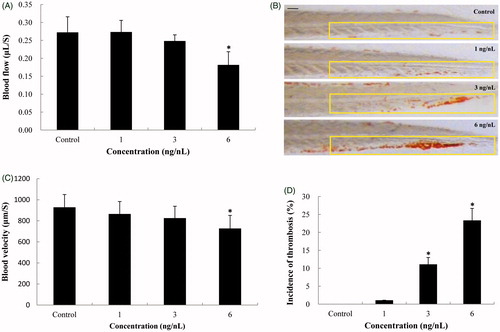
Figure 7. Effect of SiNPs on the JAK1/TF signaling pathway. (A) Heat map from microarray analysis of inflammation–coagulation cascade related genes. (B) qRT-PCR analysis showed that the genes involved in inflammation–coagulation response. (C,D) SiNPs activated the JAK1/TF signaling pathway in a dose-dependent manner. n = 50, data are expressed as mean ± standard deviation from three independent experiments (*p < 0.05).
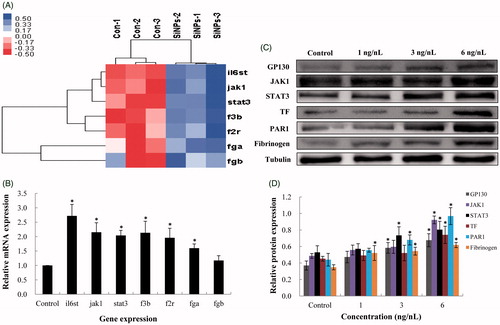
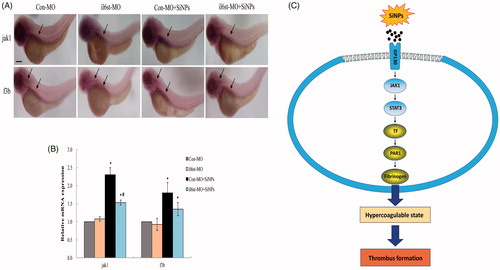
Figure 8. Knockdown of il6st declined the expression of jak1 and f3b induced by SiNPs. (A) Whole-mount in situ hybridization analysis showed that the expression pattern of jak1 in zebrafish embryos was only otic capsule; while the f3b expression pattern was hindbrain and otic capsule. (B) Quantitative analysis demonstrated that the expression jak1 and f3b induced by SiNPs were decreased in il6st-MO group compared to Con-MO group. (C) A schematic model of the molecular mechanisms involved in this study was presented. Signaling molecules with blue color denote as inflammation-related proteins; while gold color denote as coagulation-related proteins. n = 50, data are expressed as mean ± standard deviation from three independent experiments (*p < 0.05).