Figures & data
Table 1. Size of Au-nanoparticles measured with three different methods, including dynamic light scattering (DLS), differential sedimentation centrifugation (DSC), and absorbance spectroscopy.
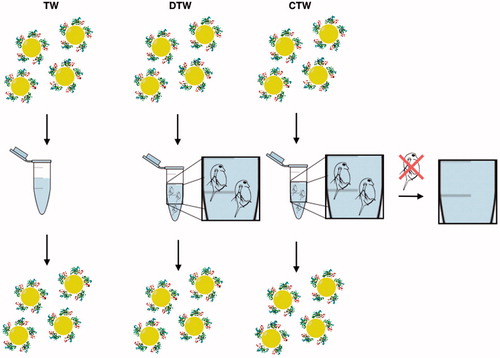
Figure 1. Au nanoparticles were incubated under three conditions: TW (tap water), DTW (tap water containing Daphnia) and CTW (conditioned tap water, in which Daphnia had filtered the water for 24 h before removal). The media were then analysed with dynamic light scattering (A), disc centrifugation (B), absorbance spectroscopy (C) and trans emission electron microscopy (D). The particles and proteins in DTW and CTW were further analysed by SDS gel chromatrography (E) and mass spectrometry (F).
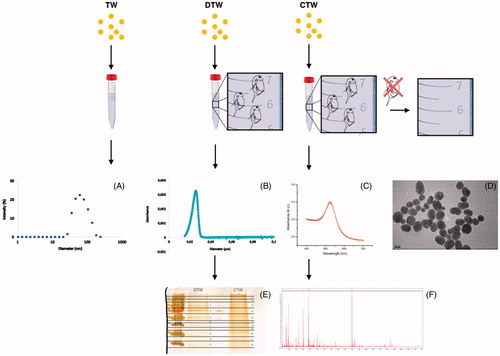
Figure 2. Absorbance spectra of Au nanoparticles when incubated in tap water (TW) at (A) 0 hour, i.e. the samples were taken right after the particles were added to the test tubes, (B) 1 hour, (C) 4 hour and (D) 24 hours (4 samples each), with (E) TEM image from particles in tap water (TW).
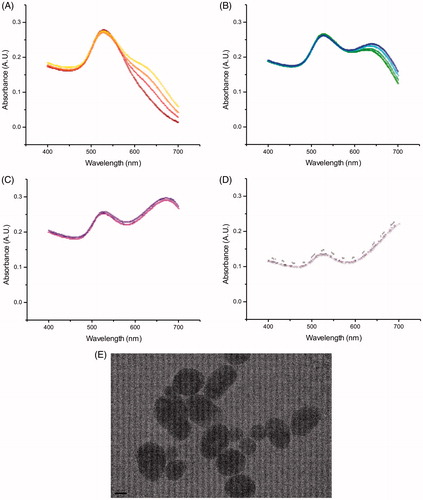
Figure 3. Absorbance spectra of Au nanoparticles when incubated with Daphnia (DTW) at (A) 0 h, i.e. a sample taken right after the particles were added to the test tubes, (C) 1 h, (E) 4 h and (G) 24 h (four samples each), with TEM images at time points (B) 0 h, (D) 1 h, (F) 4 h and (H) 24 h.
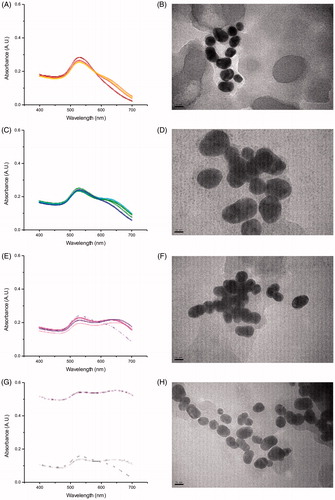
Table 2. Diameter of Au nanoparticles at different incubation times in TW, CTW and DTW, as determined by DLS, DSC and absorbance spectroscopy (N = 4 for each time point).
Figure 4. Absorbance spectra of Au nanoparticles when incubated in conditioned water (CTW) at (A) 0 h, i.e. samples were taken right after the particles were added to the test tubes, (B) 1 h, (C) 4 h and (D) 24 h (four samples each), with (E) TEM image from particles in conditioned water (CTW).
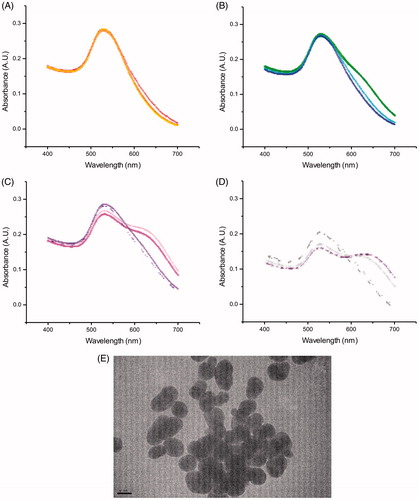
Figure 5. Images of (A) Daphnia (control) and (B) Daphnia exposed to Au nanoparticles after 4 h of incubation.
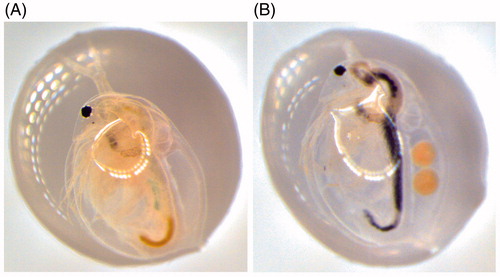
Table 3. Diameter of Au nanoparticles at different time points for BSA-coated particles (N = 3 for each time point).
Figure 6. Au nanoparticles were incubated under three conditions TW (tap water), DTW (tap water containing Daphnia) and CTW (conditioned tap water in which Daphnia had filtered the water during 24 h prior to being removed). The water was then analyzed with DLS, DSC, absorbance spectroscopy and TEM. In TW the particles aggregate. In DTW and CTW proteins and other biomolecules present bind to the particles affecting the size of the aggregates. As shown in the Venn diagram, the overlap in the number of identified proteins (n = 8) is very low compared to the overall number of proteins present in DTW (red, n = 90) vs. CTW (blue, n = 175).
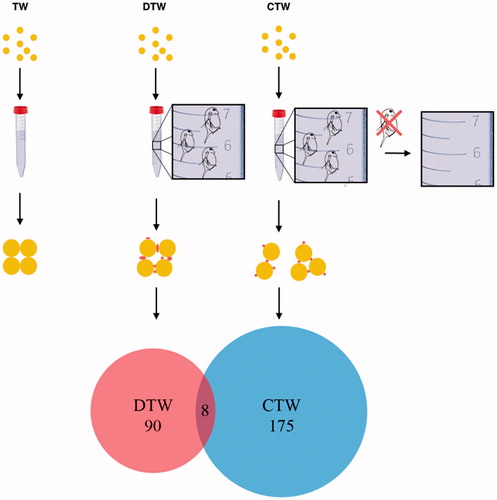
Figure 7. BSA-coated Au nanoparticles were incubated under three conditions TW (tap water), DTW (tap water containing Daphnia) and CTW (conditioned tap water, pre-incubated with Daphnia for 24 h before removal). The media were then analyzed with DLS, DSC, UV–VIS and TEM showing that the particles do not aggregate but remain in their initial state.