Figures & data
Figure 1. (A) Morphology of zebrafish treated with 100 µg/mL of NAs at the different time points investigated (4, 24, 48, 72, 96, and 120 hpf). Scale bars = 500 µm. (B) Malformations rates for each abnormality versus NAs concentration in different larvae’s parts at 96 hpf (head, tail, heart, yolk sac). Data are expressed as means ± standard deviations from three independent experiments; number of fish in each control and treated groups in one experiment = 80 (*p ≤ 0.01).
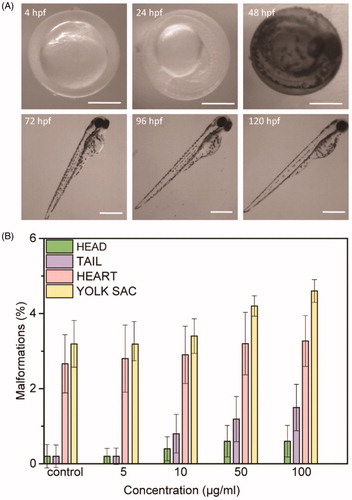
Figure 2. (A) Survival rate and (B) hatching rate of embryos treated with different concentration of NAs up to 120 hpf. (C) Heart beat rate and (D) total distance of swimming of larvae at 96 hpf treated with different concentration of NAs. Data are expressed as means ± standard deviations from three independent experiments; number of fish in each control and treated groups in one experiment =80 (*p ≤ 0.01).
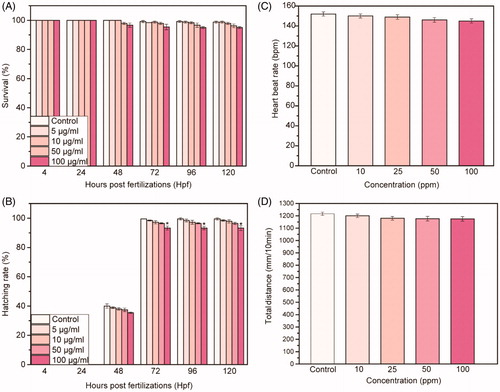
Figure 3. Maximum intensity projections of embryos at 48 hpf (A) and of larvae at 72 hpf (B) exposed to 100 µg/mL of NAs. Exposure time: 100 ms. Scale bar = 500 µm. Ch: chorion; E: Eye; YS: yolk sac.
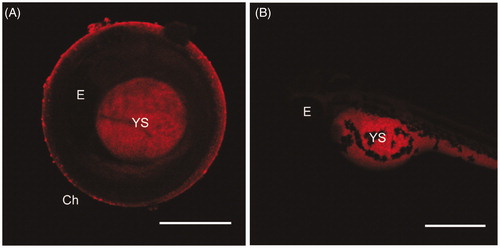
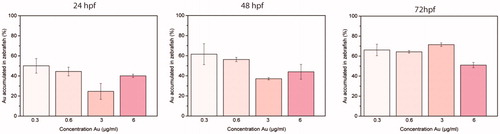
Figure 4. Normalized percentages of gold measured by ICP-AES in zebrafish embryos and larvae at 24, 48, and 72 hpf treated with 5, 10, 50, and 100 µg/mL of NAs (respectively, 0.3, 0.6, 3, and 6 µg/mL in gold). Five embryos/larvae were analyzed per condition. Data are expressed as means ± standard deviations from three independent experiments; number of fish in each control and treated groups in one experiment = 80 (*p ≤ 0.01).AQ1: Please note that the Funding section(s) has/have been created from information provided through CATS. Please correct if this is inaccurate.