
Figures & data
Figure 1. (A) TEM image of nano-sized CuO NP. (B) TEM image of Cu2CO3(OH)2 NP.
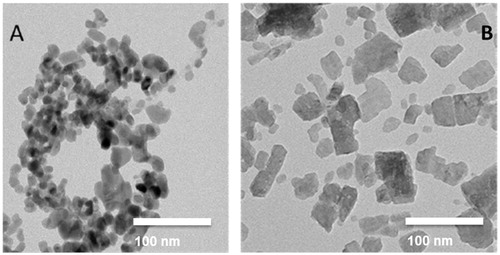
Figure 2. Dissolution of Cu2CO3(OH)2 NPs (blue) and CuO NPs (orange) during flow-through testing at 37 °C. A pH1.6 stomach simulant. B. pH 5.8 GI-tract simulant FeSSIF V2. C. pH 5.4 simple medium 0.1 NaNO3. Quantification of ions was by ICP-OES.
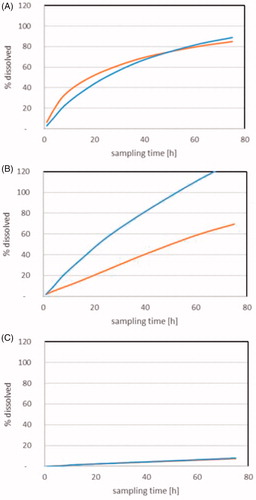
Figure 3. Body and organ weight (g) in male rats after five days consecutive oral administration of Cu2CO3(OH)2 NPs. Analysis of tissues was conducted at day 6/7 (24/48 hours after the last administration). The number of animals per group were 4 (n = 4). Two groups of the dose group of 128 mg/kg b.w. are presented for autopsy at days 6/7 after treatment. For one group (blocked columns) an unscheduled autopsy was conducted due to the poor condition of the animals intended for recovery group. Significant differences compared to vehicle treated animals. *p < 0.05, **p < 0.01 (ANOVA). An extended set of body weight data are presented in Supplementary Table 2(C,D).
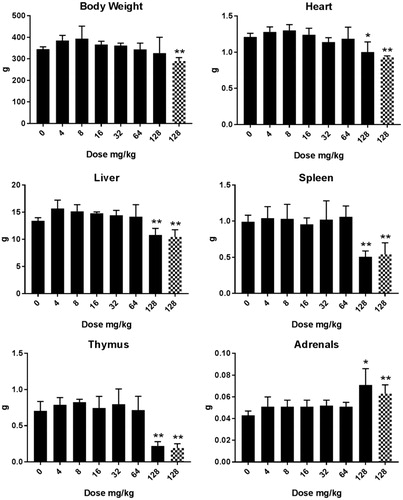
Figure 4. Hematology in male rats after five days consecutive oral administration of CuO NPs. Analysis was conducted at day 6 (24 hours after the last administration). The animals treated with a dose of 512 mg/kg were an extra group which were treated subsequently and without a concurrent control. Significant differences with vehicle treated animals were determined by ANOVA for the dose response study followed by a one sided students t-test between groups. *p < 0.05, **p < 0.01, ***p < 0.01. An extended set of hematology parameters are presented in Supplementary Table 3(A,B).
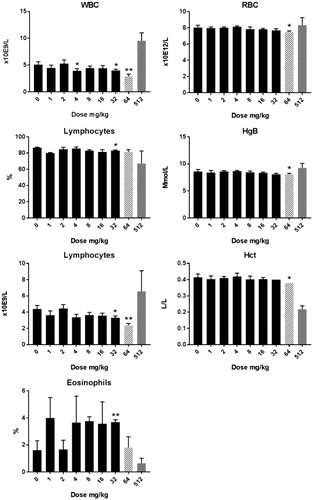
Figure 5. Clinical chemistry in male rats after five days consecutive oral administration of CuO NPs. The data presented represent analysis at day 6 (24 hours after the last administration). The abbreviations represent: ALP: alkaline phosphatase; ALT: alanine aminotransferase; AST: aspartate aminotransferase; Fe: iron; GGT: gamma glutamyltransferase; GLU: glucose; LDH: lactate dehydrogenase; SHP: plasmatic thiol groups; TBAX: total bile acids. For all groups n = 4 with the exception of the (pilot study) dose of 64 mg/kg in which n = 2. Significant differences compared to vehicle treated animals. *p < 0.05 compared to vehicle control (ANOVA), **p < 001 compared to vehicle control (ANOVA). Animals terated with a dose of 512 mg/kg were an extra group conducted without a concurrent control. An extended set of clinical chemistry parameters are presented in Supplementary Table 5(A,B).
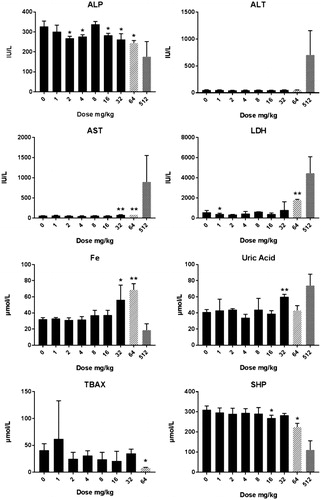
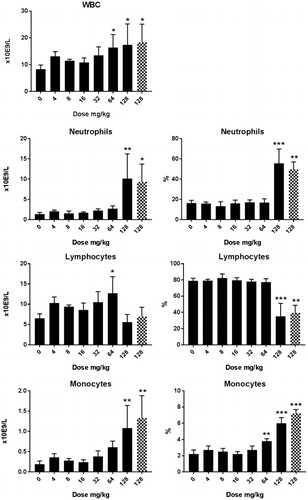
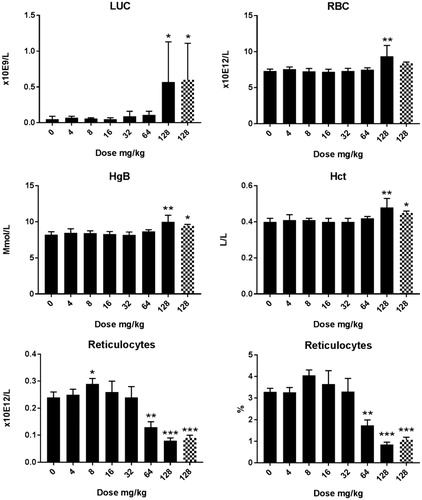
Figure 7. Cytospin preparation of bone marrow. Abundant presence of myeloid cells in the bone marrow cell population after being treated with 128 mg/kg Cu2CO3(OH)2 NPs for five consecutive days (day 1–5). The left hand image is the vehicle control (day 6), while the right hand image is the Cu2CO3(OH)2 NP treated animal on day 7. * Myeloid progenitor cells, # erythroid progenitor cells. Magnification ×500.
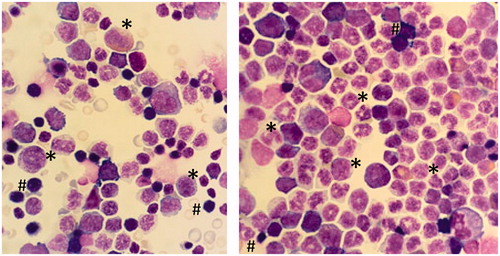
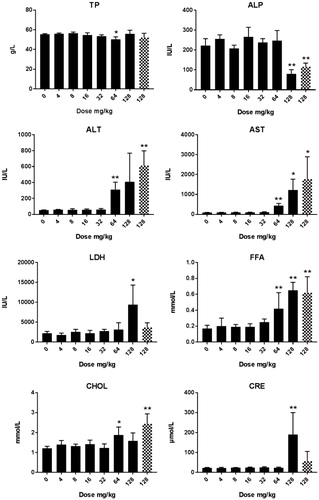

Figure 9. Presence of inflammation (arrows) in the submucosa of the stomach in a rat treated with a dose of 64 mg/kg b.w. of Cu2CO3(OH)2 NP for five consecutive days. Autopsy was at day 6, 1 day after the last Cu2CO3(OH)2 NP administration. The left image provides an overview, while the right image provides detail of inflammatory cells (arrows).
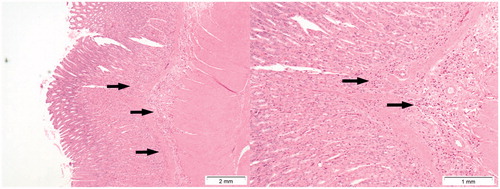
Figure 10. Presence of ulceration of colon mucosa (arrow, right image) of a rat treated with 128 mg/kg b.w. of Cu2CO3(OH)2 NPs for five consecutive days. Note severe inflammation (asterisk) and loss of colon epithelium above the area of inflammation. The autopsy was conducted at day 6, 1 day after the last Cu2CO3(OH)2 NP administration. The left image is of the colon of a vehicle treated control animal.
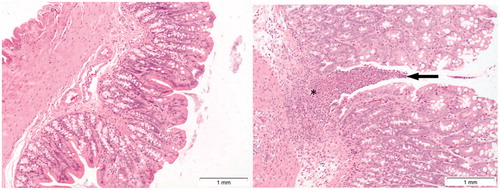
Figure 11. Presence of toxic effects in the liver following Cu2CO3(OH)2 NP administration. The top left image represents the liver of a vehicle control treated animal. The top right image indicates the presence of inflammation (arrow) and vacuolisation (asterisks) of liver parenchyma cells. The bottom image indicates single cell necrosis of liver cells (arrows). The autopsy was conducted at day 7, 2 days after the last Cu2CO3(OH)2 NP administration. The liver with histopathological lesions was from an animal treated with 128 mg/kg b.w. of Cu2CO3(OH)2 NPs for five consecutive days (days 1-5).
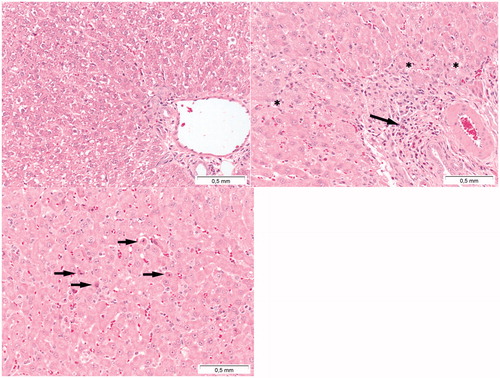
Figure 12. Presence of toxic effects in the spleen following Cu2CO3(OH)2 NPs exposure. The left image shows the histology of a normal spleen of a control animal. Note the extensive presence of lymphocytes (white pulp) (asterisks). The right image shows lymphoid atrophy as shown by the depletion of lymphocytes (white pulp) (asterisks). The right hand image is from day 6 of an animal treated with Cu2CO3(OH)2 NPs 128 mg/kg b.w. for five consecutive days (days 1-5).
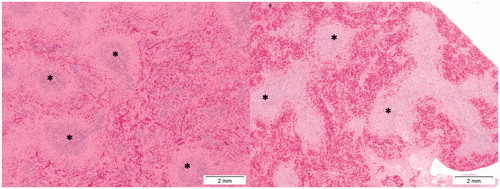
Figure 13. Effects of Cu2CO3(OH)2 NPs on the thymus. The left image shows the histology of a normal thymus of a control animal. Note the extensive presence of lymphocytes in the thymus cortex (asterisks) and medulla (plus). The right image is from day 6 of an animal treated with Cu2CO3(OH)2 NPs 128 mg/kg for five consecutive days (days 1–5). The histology shows lymphoid atrophy as shown by the low number of lymphocytes present resulting in a disappearance of demarcation between cortex and medulla.
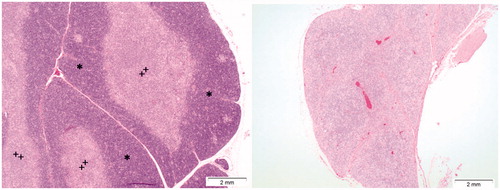
Table 1. Cu content of organs of male rats after five consecutive days of oral administration of CuO NPs.
Table 2. Cu content in organs of male rats after five consecutive days of oral administration of Cu2CO3(OH)2 NPs.
Table 3. Bench mark dose calculations for toxic effects after oral CuO NPs exposure for five consecutive days.
Table 4. Bench mark dose calculations for toxic effects after oral Cu2CO3(OH)2 NPs exposure for five consecutive days.