Figures & data
Figure 1. Characterization of PVP-coated AgNPs. (A) Representative dynamic light scattering (DLS) profiles of 50 nm bare AgNPs and (B) AgNPs after protein corona formation. (C,D) AgNPs stability in the exposure culture media at 24 h and 48 h. Transmission electron microscope (TEM) images of 50 nm AgNPs provided by the manufacturer (E).
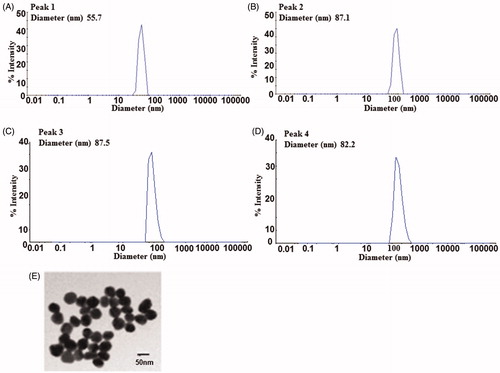
Figure 2. Expression of ZO-1 and Claudin-5 in hCMEC/D3 cells. hCMEC/D3 and astrocytes cells were grown in co-culture on transwell membranes and stained for Claudin-5 and ZO-1 at day 8. Scale bar 10 µm.
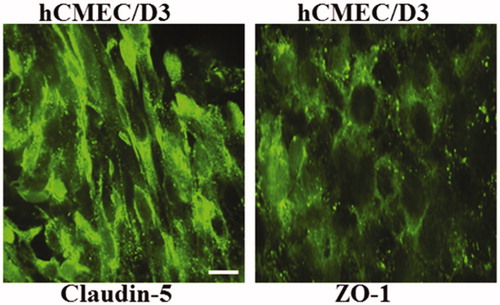
Figure 3. MTS assay in hCMEC/D3 cells exposed for 24 h and 48 h. Values in % compared to control group. Data are presented as the mean + sd of four independent replicates. Asterisks indicate effects in comparison to control (*p < 0.05).
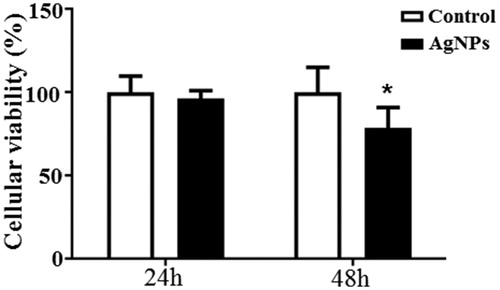
Figure 4. Measurements of dissolved silver from AgNP in the exposure media after 24 and 48 h time points by ICP-MS. Ag + concentrations were measured after spinning down the AgNPs from the media solution. Values are given as ppm. Data are presented as the mean + SD of three independent replicates. p < 0.05.
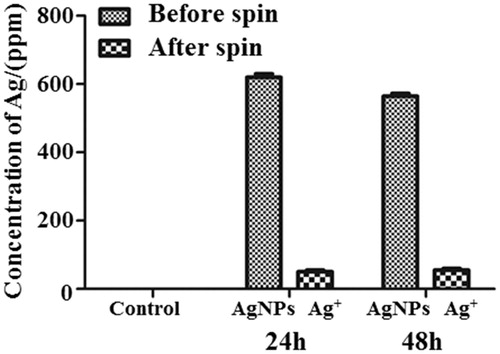
Figure 5. Proteomics work flow. BBB cells (endothelial cells and astrocytes) were treated with 50 nm AgNPs (10 μg/ml). Untreated cells were used as controls. Proteins were digested with trypsin and labeled with TMT 10-plex. The samples were combined in equal amounts and subjected to high pH fractionation. Each of the 8 fractions collected was subjected to nLC-MS/MS analysis.
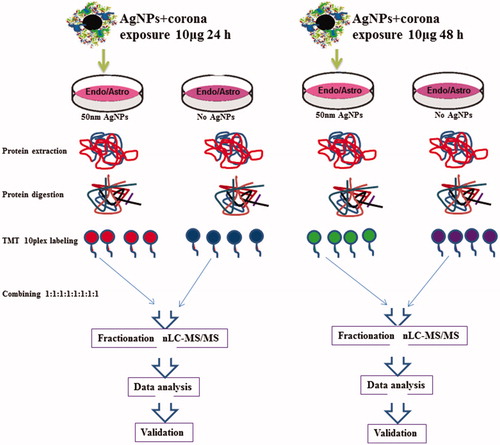
Figure 6. Reactome and wikipathway analysis of endothelial cells exposed for 24 h to 50 nm AgNPs. Pathways and proteins shaded in red are upregulated and pathways shaded in green are downregulated respectively. ▲ represents reactome reactions. ● represents reactome pathways. ▼ represents wikipathways.
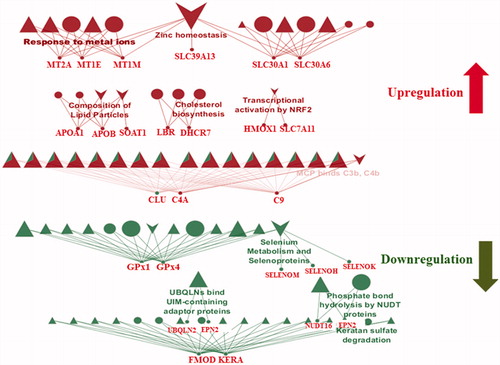
Figure 7. Reactome and wikipathway analysis of endothelial cells exposed for 48 h to 50 nm AgNPs. Pathways and proteins shaded in red are upregulated and pathways shaded in green are downregulated respectively. ▲ symbol represents reactome reactions. ● symbol represents reactome pathways. ▼ symbol represents wikipathways.
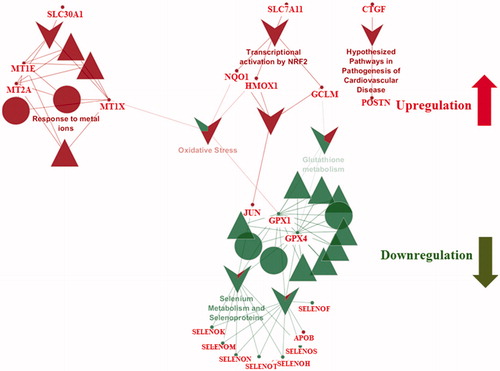
Figure 8. Intracellular trafficking of 50 nm AgNPs in endothelial cells and astrocytes. Transmission electron microscopy (TEM) shows that AgNPs accumulated in endothelial cells (A,E) and in astrocytes (B,F) after 24 and 48 h exposure. The controls of endothelial cells and astrocytes are displayed as panel (C,G) and (D,H), respectively. Scale bar 1 µm.
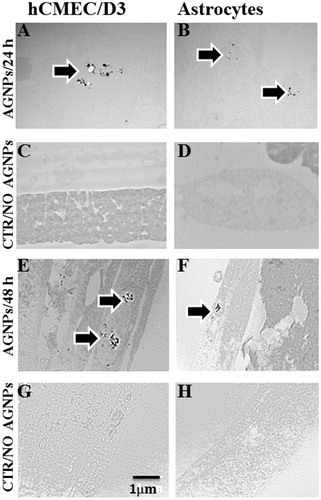
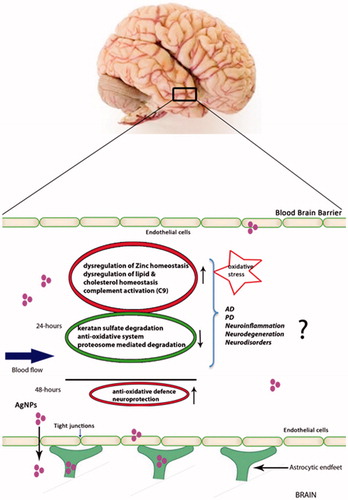
Figure 9. Schematic representation of AgNPs entry into the brain. AgNPs pass through the BBB from the blood and enter the brain, affecting the BBB proteome. Figure displays various cellular pathways upregulated and downregulated in endothelial cells in response to AgNPs exposure.