Figures & data
Figure 1. Physico-chemical characterization of tested materials, few-layer graphene (FLG) and graphene oxide (GO): thermogravimetric analysis (a); average Raman spectra (b); elemental analysis (c); lateral size distribution of sheets (n = 100) (d); representative TEM images of FLG (e, bar = 200 nm) and GO (f, bar = 500 nm) sheets.
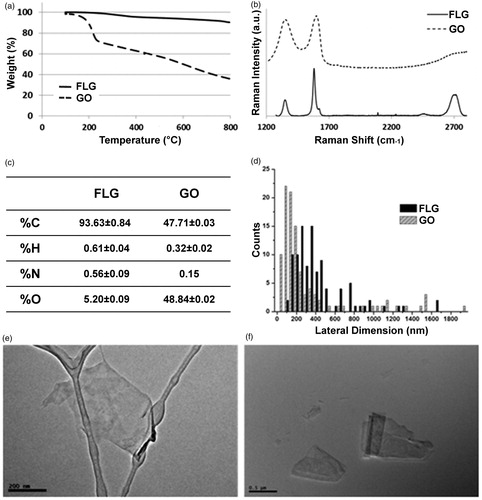
Figure 2. Cells of Trebouxia gelatinosa observed by confocal laser scanning microscopy in reflection mode. Cells before the short-term exposure observed with FLG setting (a) and GO setting (b); after the 30-minute-long exposure to 50 µg mL−1 FLG (c) or GO (d); 3D reconstruction of cells after the 30-minute-long exposure to 50 µg mL−1 FLG with FLG setting (e). Red signal: autofluorescence of chlorophylls; weak green signal reflected by algal cell walls (b,d); strong green signal reflected by FLG (c,e) or GO (d) sheets.
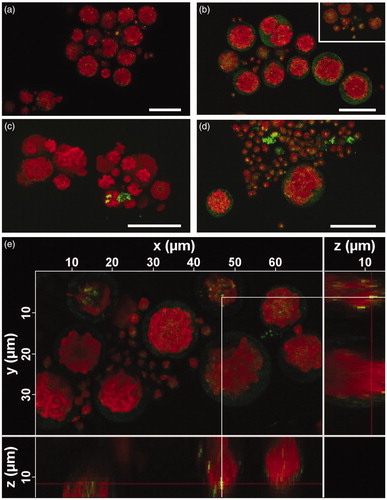
Figure 3. Raman spectra and respective Raman images (bar = 10 µm) of Trebouxia gelatinosa after short-term exposure to 50 µg mL−1 GBMs. Representative Raman spectrum of GBMs-free algae (a); few-layers graphene (FLG) (b); water-washed, FLG-exposed algae (c); graphene oxide (GO) (d); water-washed, GO-exposed algae (e). Power density (mW µm−2): 0.6 (α); 3.0 (β); 6.0 (γ).
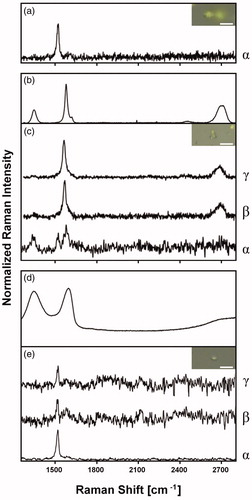
Figure 4. Micrographs of Trebouxia gelatinosa observed by TEM. Samples resuspended for 30 min in distilled H2O (a,b) and 50 μg mL−1 FLG (c,d) or GO (e,f). Bar = 1000 nm in (a,c–f); 500 nm in (b,f).
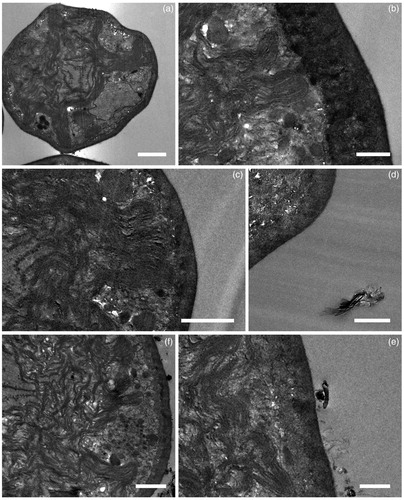
Figure 5. Maximum quantum yield of PSII photochemistry (Fv/Fm) measured in Trebouxia gelatinosa resuspended for 10 (white bars) and 30 (gray bars) min in distilled H2O (CTRL), H2O2 solutions (0.05 M, 0.5 M and 0.8 M) and GBMs suspensions (FLG or GO; 50 μg mL−1). Boxplots report median, 25°–75° percentiles (boxes) and non-outlier minimum and maximum (whiskers). *p ≤ 0.05, **p ≤ 0.01, (n = 18).
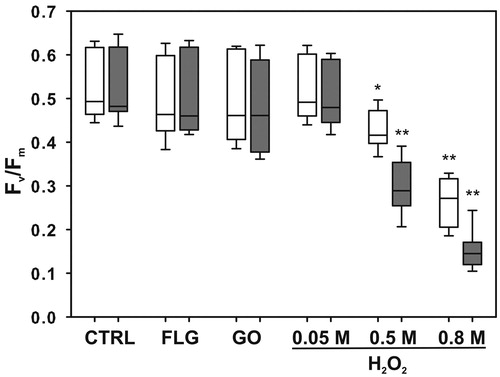
Figure 6. Fold change in the expression of 8 transcripts obtained with qRT-PCR in cultures of Trebouxia gelatinosa treated with H2O2 (0.05 M, 0.5 M and 0.8 M) or GBMs (FLG or GO; 50 μg mL−1) compared to the respective controls (dotted line) after 10 (a) and 30 (b) min of exposure. APX: ascorbate peroxidase; CAT: catalase; GR: gluthatione reductase; Mn-SOD: manganese superoxide dismutase; DRP11: desiccation related proteins 11; HSC70: heat shock cognate 70; HSP70-1: heat shock protein 70 1; LHCII: chlorophyll a-b binding protein of the light harvesting complex II. *p ≤ 0.05, **p ≤ 0.01 (n = 3).
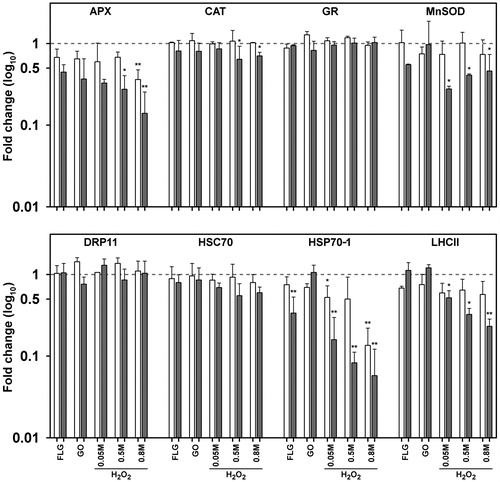
Figure 7. Levels of HSP70 protein in Trebouxia gelatinosa exposed to various concentrations of H2O2 (0.05 M, 0.5 M and 0.8 M) and GBMs (FLG or GO; 50 μg mL−1) compared to the respective controls after 10 (white bars) and 30 (gray bars) min of exposure. *p ≤ 0.05, **p ≤ 0.01 (n = 3).
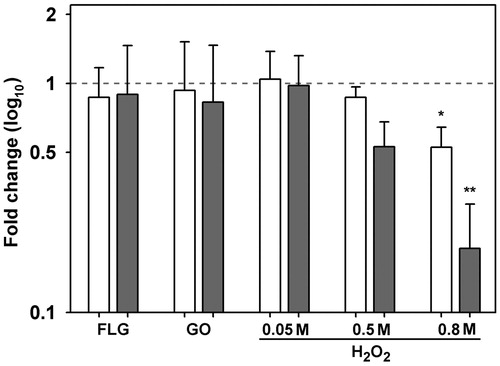
Figure 8. Potassium (K+) leakage in Trebouxia gelatinosa. Total K+ content of pre-exposure samples (TOTAL); K+ leakage from control samples washed but not shaken (WASHED); samples washed and shaken for 30 min without GBMs (S 30’) and with 50 μg mL−1 FLG (S 30’+FLG) or GO (S 30’+GO) (n = 9).
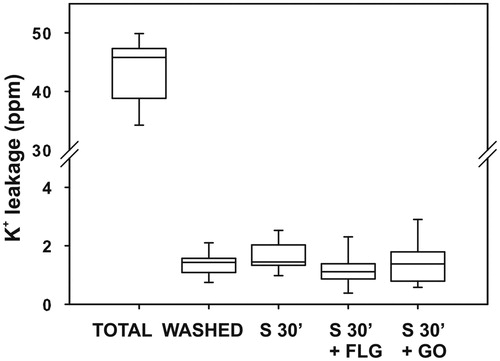
Figure 9. Growth dynamics of Trebouxia gelatinosa grown for up to 16 days over PTFE membranes on solid Trebouxia Medium without (CTRL) or with FLG or GO at 0.01, 1 or 50 μg mL−1 (n = 3).
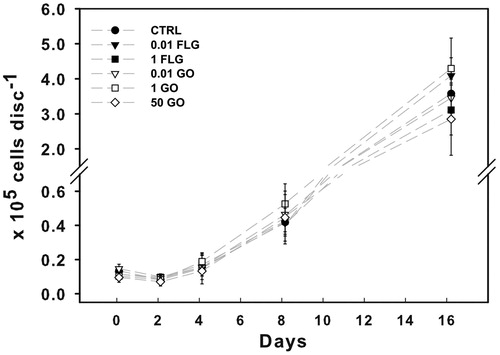
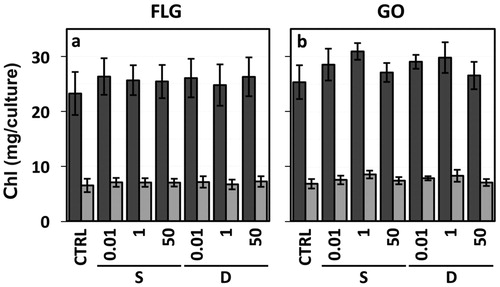
Figure 10. Chlorophyll a (dark gray bars) and b (light gray bars) content measured in 4-week-old colonies of Trebouxia gelatinosa. The cells were exposed to FLG (a) and GO (b) at 0, 0.01, 1, 50 µg mL−1 (CTRL, 0.01, 1, 50 respectively), through the ‘shaken’ and ‘deposit’ treatments (S and D, respectively) (n = 7).