Figures & data
Table 1. Summary of particle effects on the morphology and function of intestinal epithelium in the nematode Caenorhabditis elegans.
Figure 1. Silica NPs induce untimely premature gut aging in young worms. (A) Schematic cartoon of the intestinal ballooning phenotype. Wild type (N2) worms were left untreated or fed with silica particles for 48 h. (B) Representative differential interference contrast (DIC) of a 2-day-old adult C. elegans that was mock-treated with H2O. (C–E) Representative micrographs of 2-day-old adult C. elegans that were fed with 0.2 mg/mL silica NPs. The worms show intestinal ballooning. (F) Representative micrograph of a 2-day-old adult C. elegans that was fed with 0.5 mg/mL BULK silica. Bar, 25 µm. (G) Representative micrograph of a 12-day-old adult C. elegans showing intestinal ballooning. Bar, 25 µm. (H) Quantification of the number of wild type (N2) worms showing intestinal ballooning (three independent experiments). Values represent means ± SD from at three independent experiments with n = 74–128 per experiment. (I–M) Violin plots for respective quantification of the number of worms showing ballooning. Significant differences (p < 0.01) after 48-h exposure for each group compared with H2O (I) and BULK silica (J). Values represent means ± SD from at least five independent experiments with n = 32–197 per condition per experiment.
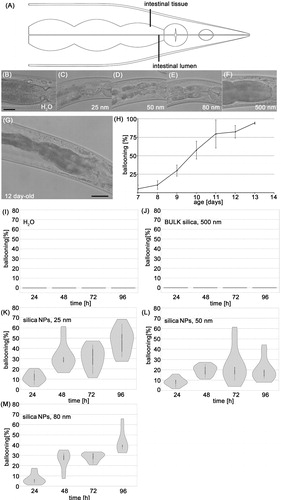
Figure 2. Uptake routes of silica particles. (A–C) Representative micrographs of 2-day-old adult C. elegans that were fed with 0.2 mg/mL rhodamine-labeled silica NPs for 48 h. Top row: epifluorescence (red) merged with differential interference contrast (DIC) microscopy; middle: epifluorescence was inverted to gray scale; bottom: epifluorescence was inverted to pseudocolor and intensity map. (A,C) Nanosilica synthesized by the Hartlen preparation. (B) Nanosilica synthesized by the Stoeber process. Bar, 15 µm. (D) Representative micrographs of 2-day-old adult C. elegans that were treated with 0.5 mg/mL rhodamine-labeled BULK silica particles for 48 h. Top: epifluorescence merged with DIC; middle: gray scale; bottom: pseudocolor and intensity map. (E) Top: schematic of the localization of Hartlen nanosilica (25 and 80 nm) in a single intestinal cell within gut granules (GGs, red); middle: blow up of a single (anteriormost) intestinal cell, merged epifluorescence (red) and DIC; bottom: schematic of an entire worm with colored gut (red) and inset that locates anteriormost intestinal cells. Bar 7.5 µm. (F–G) Representative micrographs of 2-day-old adult pep-2 mutants that were treated with 0.2 mg/mL rhodamine-labeled Hartlen silica NPs for 48 h. In OPT-2/PEP-2 deletion mutants Hartlen nanosilica locate in the gut lumen. Bar, 15 µm. GGs, gut granules; intensity, fluorescence intensity in arbitrary units; nm, nanometer; nucleus, cell nucleus; pep-2, OPT-2/PEP-2 deletion mutant. Note: Colour version of this figure is available online.
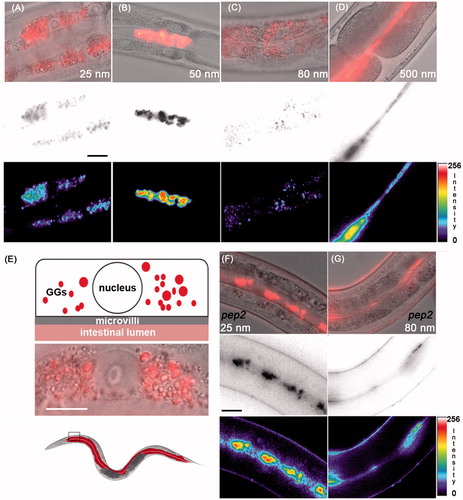
Figure 3. Nanosilica disrupts peptide trafficking in intestinal epithelial cells. Representative micrographs show the localization of the dipeptide reporter substrate ß-Ala-Lys-AMCA in intestinal cells of 4-day-old, adult C. elegans. Wild type worms (N2) were left untreated H2O (A, A′, A″) or exposed to silica NPs (50 nm; B, B′, B″) or BULK silica (500 nm; C, C′, C″) for 72 h and cultivated with the fluorescent dipeptide derivate ß-Ala-Lys-AMCA at 20 °C. ß-Ala-Lys-AMCA staining indicates peptide localization as epifluorescence micrographs (middle, blue) and as pseudocolor intensity map (bottom). Bar, 10 µm. (D, D′, D″) Daf-2 mutants (e1370) were fed with 50 nm silica NPs for 72 h and cultivated with ß-Ala-Lys-AMCA at 15 °C. Fluorescence staining (D′, blue) and pseudocolor intensity map (D″, red) shows formation of small vesicles along the apical domain. (E,F) Schematic visualization of ß-Ala-Lys-AMCA distribution after silica NPs exposition in single intestinal cells of wild type (N2) worms or (G) daf-2 mutants. (H) Quantification of the vesicle size in nanosilica-exposed N2 worms after 72 h. (I) Graph depicting the number of worms with 3 vesicles per cell (black) and number of vesicles per cell (blue) over time. Values represent means ± SD from three independent experiments with n = 16–80 animals per experiment. (J) For determination of the lowest observed effect level (LOAEL) of vesicle formation, adult C. elegans were mock-treated (H2O, white), exposed to increasing concentrations of silica NPs (gray) or to BULK silica (black). Values represent means ± SD from 3 to 5 independent experiments with n = 16–39 per condition per experiment. (K) Vesicle formation in 4-day-old adult wild type (N2) worms compared with age-matched daf-2 mutants or daf-16 mutants after silica exposition (200 µg/mL). Staining patterns of daf-2 mutants were categorized into the groups apical versus random localization. Values represent means ± SD from three independent experiments with n = 20–25 per condition per experiment. (L) Schematic of the daf-2 gene indicating the position and nature of different mutations. A mutation in the ligand-binding domain leads to a random localization of large nanosilica-induced vesicles in the cytoplasm. In contrast, the mutation in the tyrosine kinase domain of the daf-2 gene promotes formation of smaller vesicles in the apical domain (D′, D″, K). ß-Ala-Lys-AMCA, fluorescent di-peptide conjugate β-Ala-Lys-AMCA; *p < 0.05, **p < 0.01; h: hours; μg: microgram; mL: milliliter; NPs: nanoparticles. Note: Colour version of this figure is available online.
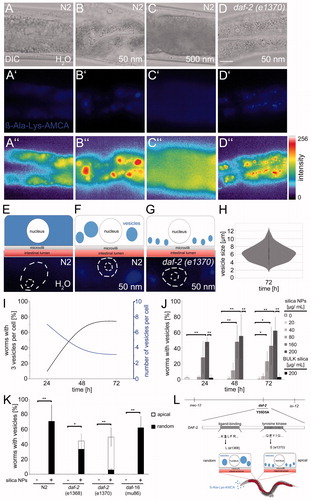
Figure 4. Nanosilica-induced peptide vesicles form independent of Glo-1 and Glo-3. (A) Representative micrographs show the uptake of rhodamine-labeled Hartlen silica NPs (25 nm, red, 200 µg/mL) into gut granules and the formation of ß-Ala-Lys-AMCA vesicles (blue) in wild type (N2) worms after 72 h. Bottom: The schematic visualizes different localization of silica NPs (red) and ß-Ala-Lys-AMCA vesicles (blue) in single intestinal cells. Bar, 13 µm. (B) Representative epifluorescence micrographs of ß-Ala-Lys-AMCA vesicles in silica NPs (50 nm) exposed wild type worms (N2), glo-1(zu391) mutants, glo-3(kx94) mutants and glo-3(zu446) mutants. Bar, 15 µm. (C) Respective quantification of worms with 2–3 peptide vesicles per cell (gray) or >2–3 peptide vesicles per cell (black) after silica exposition (200 µg/mL). Values represent means ± SD from at least four independent experiments with n = 6–28 per condition per experiment (one way ANOVA with Tukey’s post-hoc test). **p < 0.01; BULK, BULK silica particles; nm, nanometer; n.s., not significant. Note: Colour version of this figure is available online.
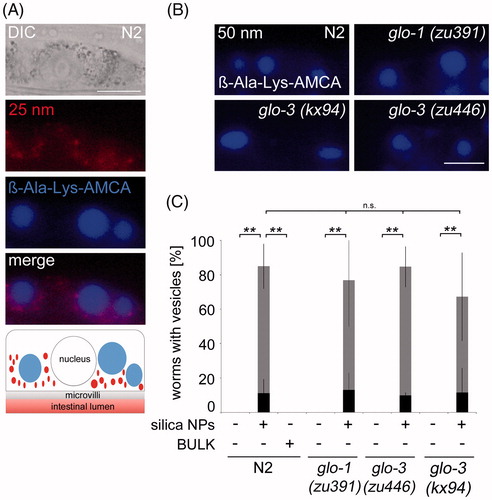
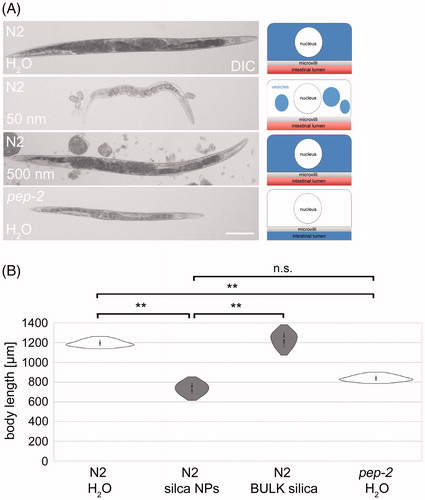
Figure 5. Nanosilica induces a ‘petite’ phenotype resembling OPT-2/PEP-2 deletion mutants. (A) Differential interference contrast (DIC) of stretched adult wild type (N2) worms that were left untreated H2O (mock control) or fed with silica NPs (200 µg/mL) or BULK silica (200 µg/mL) for 72 h at 20 °C. Bottom: pep-2(lg601) mutants were mock-treated with H2O for 72 h. Right column: schematic of respective ß-Ala-Lys-AMCA distribution within single intestinal cells. Bar, 150 µm. (B) Respective quantification of the body length. Data from three independent experiments with n = 20 per condition per experiment. **p < 0.01; n.s.: not significant; NPs: nanoparticles.