
Figures & data
Table 1. Physical chemical characteristics of the ZnO and carbon black nanomaterials.
Figure 1. Body weight gain in mice exposed to ZnO nanoparticles. Uncoated or triethoxycaprylylsilane-coated ZnO nanoparticles were administered by intratracheal instillation at 0.2, 0.7 or 2 µg/mouse. Low, medium and high designates low-dose, medium-dose and high-dose, respectively. Two or twenty-seven days later the body weight was measured and body weight gain compared to weight at exposure was calculated. Data are mean and bars represent SD. * designates a p-value of <0.05 vs. vehicle of one way ANOVA with Holm–Sidak’s multiple comparisons test. In the case of carbon black **** and * designates p-values of <0.0001 and <0.05 respectively vs. vehicle of the t-test.
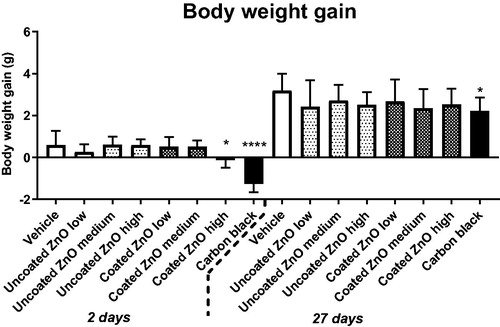
Figure 2. Total protein in BAL fluid at 1, 3 and 28 days of ZnO nanoparticle exposure. Uncoated or triethoxycaprylylsilane-coated ZnO nanoparticles were administered by intratracheal instillation at 0.2, 0.7 or 2 µg/mouse. Low, medium and high designates low-dose, medium-dose and high-dose, respectively. One, three or twenty-eight days after exposure, BAL fluid was prepared and total protein determined. Data are mean and bars represent SD. ****, ***, ** and * designates p-values of <0.0001, <0.001, <0.01 and <0.05 respectively vs. vehicle of one way ANOVA with Holm–Sidak’s multiple comparisons test. In the case of carbon black ***, and ** designates p-values of <0.001, and <0.01 respectively vs. vehicle of the t-test.
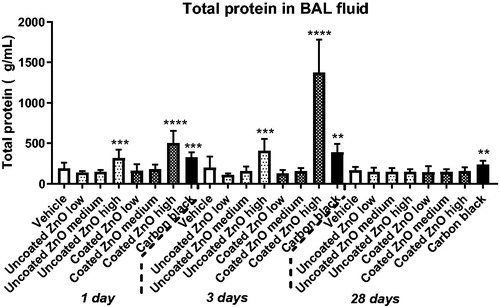
Figure 3. Neutrophil numbers in BAL fluid at 1, 3 and 28 days of ZnO nanoparticle exposure. Uncoated (uncoated ZnO) or triethoxycaprylylsilane-coated ZnO nanoparticles (coated ZnO) were administered by intratracheal instillation at 0.2, 0.7 or 2 µg/mouse. Low, medium and high designates low-dose, medium-dose and high-dose, respectively. Carbon black at 162 µg/mouse served as positive control. One, three or twenty-eight days post-exposure, BAL fluid was prepared and the number of neutrophils established by differential counting. Data are mean and bars represent SD. ***, ** and * designates p-values of <0.001, <0.01 and <0.05 respectively of one way ANOVA with Holm–Sidak’s multiple comparisons test in case of data approaching normality and not having a highly different variation (details given in the methods section), otherwise by Kruskall–Wallis test with Dunn’s multiple comparisons test. In the case of carbon black ****, ***, ** and * designates p-values of <0.0001, <0.001, <0.01 and <0.05 respectively vs. vehicle of the Mann Whitney test.
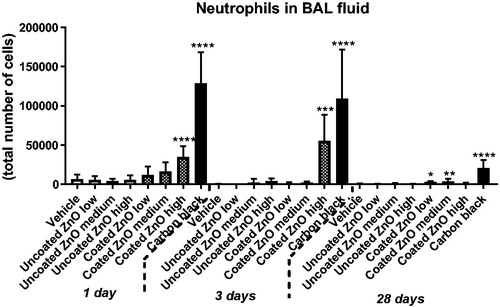
Figure 4. Saa3 mRNA levels in lung 1, 3 and 28 days of ZnO nanoparticle exposure. Uncoated (uncoated ZnO) or triethoxycaprylylsilane-coated ZnO nanoparticles (coated ZnO) were administered by intratracheal instillation at 0.2, 0.7 or 2 µg/mouse. Low, medium and high designates low-dose, medium-dose and high-dose, respectively. Carbon black at 162 µg/mouse served as positive control. One, three or twenty-eight days post-exposure lung tissue was recovered and Saa3 mRNA levels measured by quantitative real time PCR. Data are mean and bars represent SD. ****, ***, ** and * designates p-values of <0.0001, <0.001, <0.01 and <0.05 respectively vs. vehicle of one way ANOVA with Holm–Sidak’s multiple comparisons test.
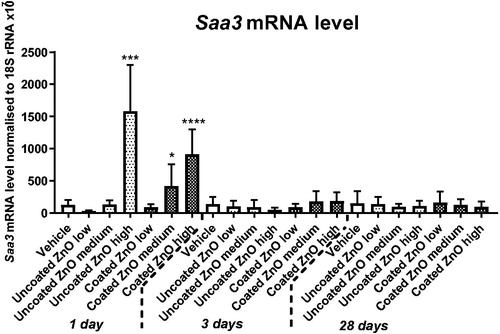
Figure 5. Levels of DNA strand breaks in BAL fluid cells at 1, 3 and 28 days of ZnO nanoparticle exposure. Uncoated (uncoated ZnO) or triethoxycaprylylsilane-coated ZnO nanoparticles (coated ZnO) were administered by intratracheal instillation at 0.2, 0.7 or 2 µg/mouse. Low, medium and high designates low-dose, medium-dose and high-dose, respectively. Carbon black at 162 µg/mouse was included as reference material. One, three or twenty-eight days later BAL fluid cells were prepared and levels of DNA strand breaks measured as percent DNA in the tail by comet assay. Data are mean and bars represent SD. * designates p-values of <0.05 vs. vehicle of one way ANOVA with Holm–Sidak’s multiple comparisons test. In the case of carbon black data were tested with t-test.
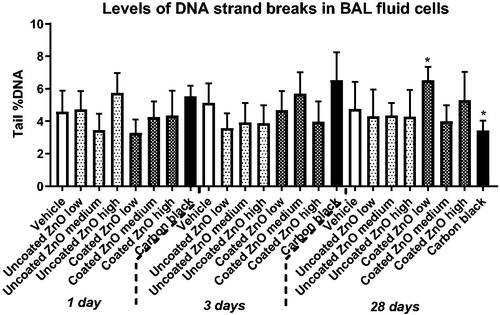
Figure 6. Levels of DNA strand breaks in lung tissue at 1, 3 and 28 days of ZnO exposure. Uncoated (uncoated ZnO) or triethoxycaprylylsilane-coated ZnO nanoparticles (coated ZnO) were administered by intratracheal instillation at 0.2, 0.7 or 2 µg/mouse. Low, medium and high designates low-dose, medium-dose and high-dose, respectively. Carbon black at 162 µg/mouse served as positive control. One, three or twenty-eight days later, lung tissue was recovered and levels of DNA strand breaks measured as percent DNA in the tail by comet assay. Data are mean and bars represent SD. ****, ***, ** and * designates p-values of <0.0001, <0.001, <0.01 and <0.05 respectively vs. vehicle of one way ANOVA with Holm–Sidak’s multiple comparisons test. In the case of carbon black data were tested with t-test.
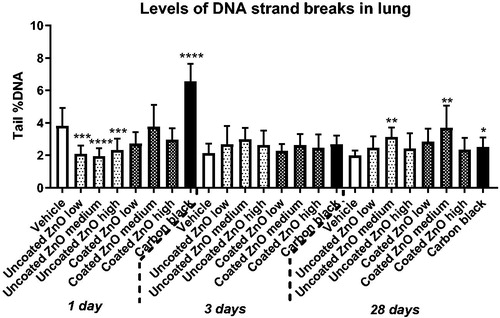
Figure 7. Canonical pathways affected by 1 or 28 days of ZnO nanoparticle exposure. Uncoated (uncoated ZnO) or triethoxycaprylylsilane-coated ZnO nanoparticles (coated ZnO) were administered by intratracheal instillation at 0.2, 0.7 or 2 µg/mouse (designated: low, medium, and high). The deeper the coloring is, the higher the effect is on the specific canonical pathway. No effects were observed at the medium dose for the coated ZnO, thus this group is not included in the figure.
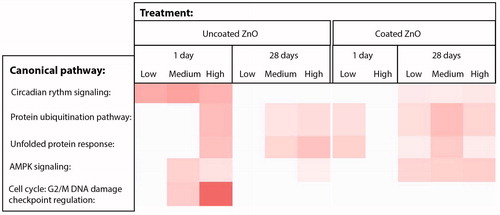
Table 2. Numbers of genes regulated with a p-value of less than 0.05.