
Figures & data
Table 1. Summary of the main physiological properties of SPIONs in the different media used for experiments including control measurements in PBS, SCM (DMEM and RPMI) and the artificial lysosomal fluid (ALF).
Figure 1. SYTOX green assay for membrane permeabilization. (A) HeLa cells exposed to Saponin, Saponin + NP, NP alone and control. The top panel shows cytoplasmic stain, 24 h following NP incubation with 280 µg/mL SPIONs. Bottom panel shows SYTOX green fluorescence that is evident in both samples treated with saponin, and not in the negative control or NP treated samples. (B) Graphical representation of the quantification of nuclear SYTOX intensity, analyzed automatically using MATLAB. Significant differences were seen between saponin treated samples and non-saponin treated samples only. Students t-Test gave significance of p < 0.001 between saponin treated and non-saponin treated samples in each cell line.
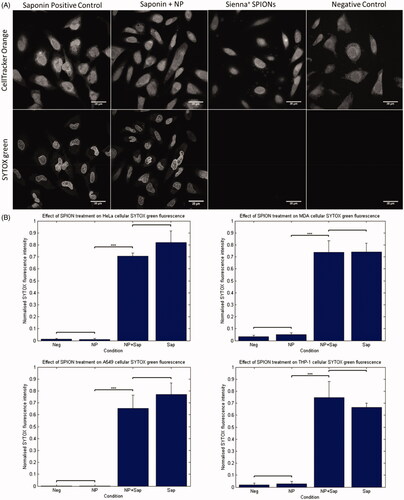
Figure 2. Uptake of SPIONs into cancer cells and THP-1 derived macrophages. (A) RCM images show SPION internalization into different cell lines. Uptake is evident in all cell lines. NPs highlighted with arrows. (B) The graphs show comparisons of the average (mean) intensity of cells following a treatment with 280 µg/mL SPIONs for different time points (left) and incubated for 1 h at different concentrations (right). Statistical significance was calculated using MATLAB ANOVA, ‘anova1’, and ‘multcompare’ functions. Multcompare uses Tukey-Kramer post hoc testing by default. THP-1 cells appeared to internalize NPs significantly more than the cancer cells p < 0.001.
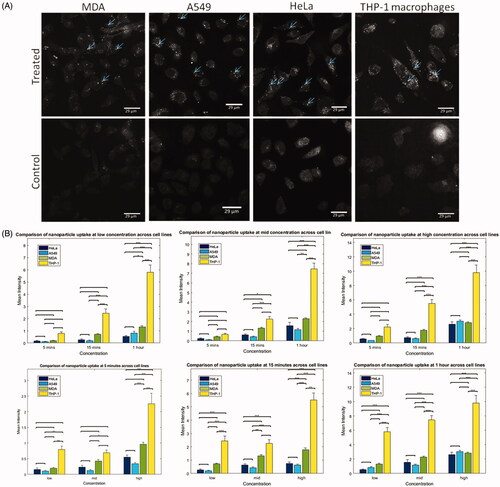
Figure 3. Calculations to obtain the number of particles that can enter a cell through fluid-phase endocytosis compared to receptor mediated endocytosis. Figures and equations adapted from Smith et al. (Citation2012). (A) The equations can be substituted to determine the most likely means of NP cellular entry: fluid phase, or receptor mediated. The close circle packing density (where all NPs are touching and attached at the surface) is 0.91. The curvature of the membrane is neglected and therefore this will be a slight over estimation. This likelihood is determined computationally using MATLAB for every vesicle diameter between 150 nm and 5000 nm in increments of 1 nm (displayed graphically as ‘likelihood’). (B) The calculation of likelihood is given for 3 examples with and without clathrin coat, each of these gives an example of how ratio of likelihood of internalization through RME compares to that within the fluid phase (based on the extracellular starting concentrations).
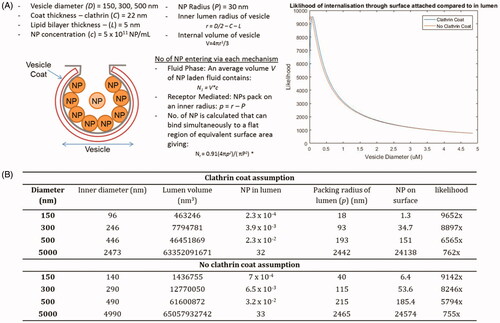
Figure 4. Quantification of SPION uptake following siRNA experiments in cancer cell lines by average cell intensity. Quantification of the NP uptake (using MATLAB to determine average cellular intensity) indicating the inhibition of NP uptake when specific pathways are inhibited in different cell lines. The graph on the right shows quantification of average knockdown efficiency from Western blots. A minimum of 238 cells were analyzed per group, from experiments run on 3 or more different days. Mean + SEM is plotted).
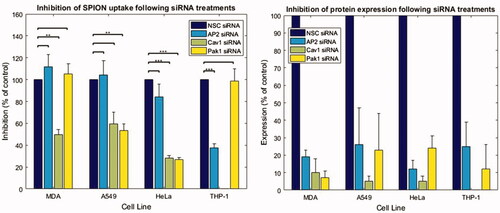
Figure 5. Colocalization of SPIONs with the lysosome. A high degree of colocalization can be visualized at longer incubation time points (24 hours and 48 hours especially). This can be seen from (A) the overlay (top left; SPIONs = gray, Lysosome = red) and the line intensity profile (lysosome = blue, SPION = green). These images can be computationally post processed and different parameters assessed (such as the degree of signal overlap) and used to make quantitative conclusions about particle tracking and fate, shown in (B). Plotted points show the mean result for each time point, error bars show the standard error of the mean (SEM). Example images showing the colocalization between the lysosomes and the SPIONs at 24 hours, in the four cell lines tested are displayed in (C).
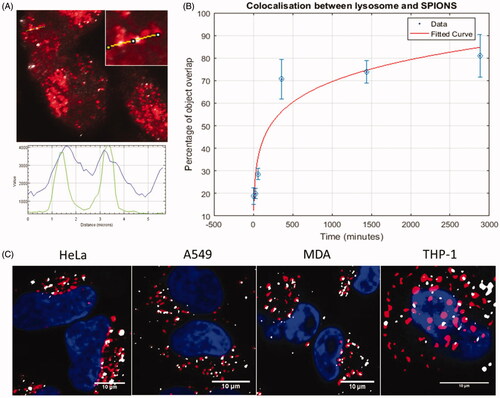
Figure 6. R-SIM provides increased resolution for colocalization studies of metallic (e.g. SPION) NPs. When combined with TEM this can indicate definitive localization. NPs with lysosomes in HeLa cells after an hour-long incubation. (A) Cells imaged with R-SIM, (B) Confocal of SPIONs indicates colocalization with the lysosome, emphasizing the substantial resolution improvement of R-SIM and confirming the findings that a large proportion of NPs colocalize to lysosomal compartments. TEM can also be included in the workflow as described in detail in Guggenheim et al. (Citation2017); an example of a TEM image showing the membrane-bound structures containing SPIONs is indicated in (C) which corresponds to the cell shown in (D).
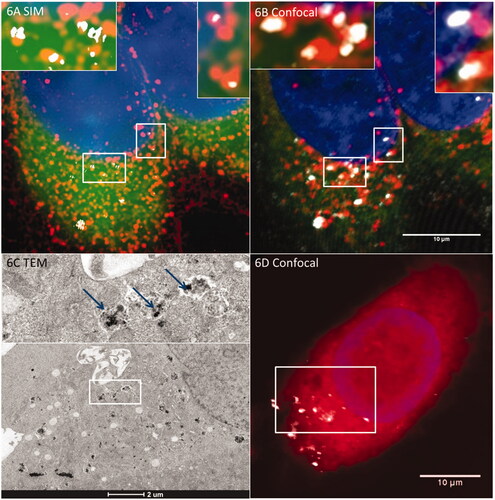
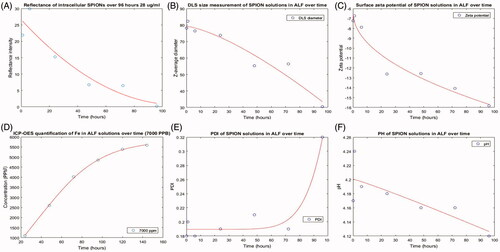
Figure 7. Dissolution of SPIONs in citrate containing ALF over a 96-hour time course. (A) A decrease in reflectance intensity is seen over time with RCM. A decrease in the diameter (nm) (B) and zeta potential (C) is also observed, and this is paralleled by an increased release of iron ions measured by ICP-OES (D) and an increase in the PDI (E) of the solution. Little change is observed in the pH of the solution (F).
TNAN-2019-OR-0112-File003.docx
Download MS Word (19.7 MB)Data availability statement
All relevant data are included in the manuscript; however, data are available on request (achieved via BEAR services at the University of Birmingham).