Figures & data
Table 1. Representative electron microscopy images and physico-chemical properties of the used test-materials.
Table 2. Study doses.
Figure 1. Neutrophil numbers in bronchoalveolar lavage fluid of mice exposed to the nanomaterials. The upper panel show data from 24 h of exposure and the lower panel from 28 days of exposure. The columns represent means and bars SD. ***, ** and * designates p values of <0.001, <0.01 and <0.05 respectively of one way ANOVA with Holm-Sidak’s multiple comparisons test in case of data approaching normality and not having a highly different variation. In the case of carbon black ***, ** and * designates p values of <0.001, <0.01 and <0.05 respectively vs. vehicle of t-test. ## and # designate Bonferroni-corrected (11 comparisons) p values of <0.01 and <0.05 of unpaired t-test or Mann-Whitney test.
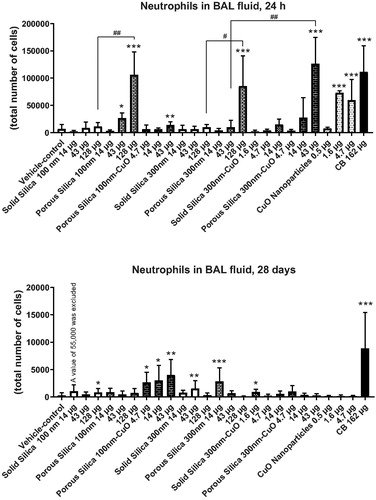
Figure 2. Neutrophil numbers in bronchoalveolar lavage fluid of mice exposed to the nanomaterials by oropharyngeal aspiration. The plots represent neutrophil recruitment to the airways 24 h, 3 and 7 days after the treatment with vehicle or nanomaterial dispersions. Data are mean and bars represent SD. ****, ***, ** and * designates p values of <0.0001, <0.001, <0.01 and <0.05 respectively of one way ANOVA with Holm-Sidak’s multiple comparisons test in case of data approaching normality and not having a highly different variation. In the case of carbon black ***, ** and * designates p values of <0.001, <0.01 and <0.05 respectively vs. vehicle of t-test. ### and ## designate Bonferroni-corrected (4 comparisons) p values of <0.001 and <0.01, respectively, of unpaired t-test or Mann-Whitney test.
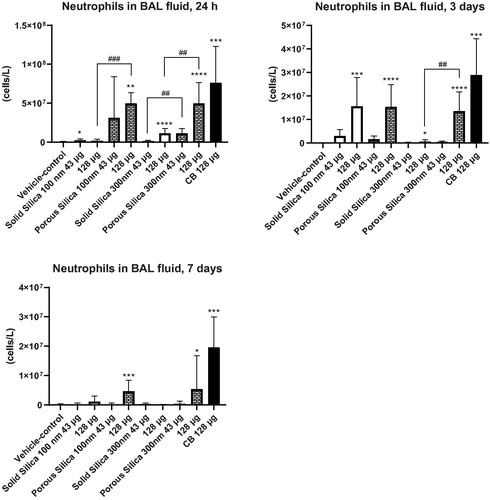
Figure 3. Neutrophil numbers in bronchoalveolar lavage fluid of mice as function of dosed BET surface area of each nanomaterial. The data on neutrophil numbers from (intratracheal instillation) are here depicted as function of dosed BET surface area per mouse. The upper panel represents data from 24 h of exposure of porous and non-porous particles; and the lower panel data from 24 h of exposure of CuO nanoparticles, porous silica 300 nm CuO and porous silica 300 nm to illustrate the effect of CuO doping. Some error bars are not depicted, because the exponential axis does not accommodate negative values.
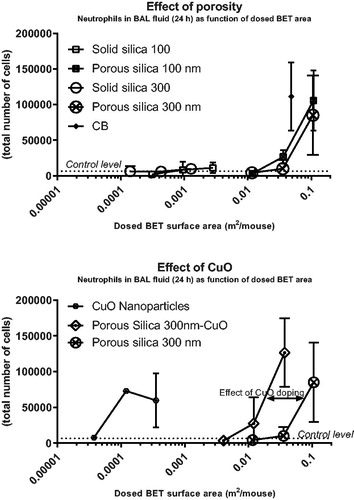
Figure 4. Saa3 mRNA level in lungs of mice exposed to silica nanomaterials. Mice were administered the silica materials by intratracheal instillation and 24 h (upper panel), and 28 days (lower panel) later the lungs were recovered, and the Saa3 mRNA level was measured by quantitative real time PCR. Data are mean and bars represent SD. ****, ***, ** and * designates p values of <0.0001, <0.001, <0.01 and <0.05 respectively, of one way ANOVA with Holm-Sidak’s multiple comparisons test in case of data approaching normality and not having a highly different variation. In the case of carbon black ****, and ** designate p values of <0.0001 and <0.01, respectively, vs. vehicle of t-test.
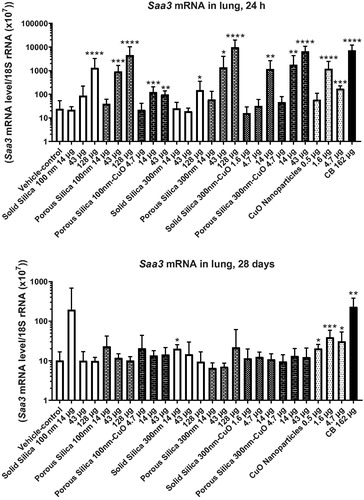
Figure 5. Saa3 mRNA levels in lungs of mice as function of dosed BET surface area of each nanomaterial. The data on Saa3 from are here depicted as function of dosed BET surface area per mouse. The upper panel represents data from 24 h of exposure of porous and non-porous particles; and the lower panel data from 24 h of CuO nanoparticles, porous silica 300 nm CuO and porous silica 300 nm to illustrate the effect of CuO doping. Some error bars are not depicted, as the exponential axis does not accommodate negative values.
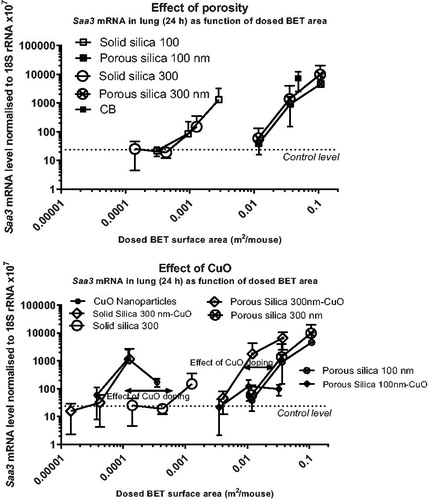
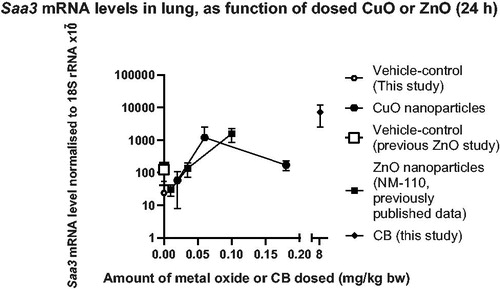
Figure 6. Saa3 mRNA levels in lungs, depicted as function of the dosed amount of CuO (current data) or ZnO (previous data). The amount of CuO in the CuO particle is described in and . The amount of ZnO dosed was calculated as a percentage of 100 of 0.2, 0.7 or 2 µg/mouse equal to ∼0.01, 0.035, and 0.1 mg ZnO/kg bw. The ZnO data were previously published (Hadrup et al. Citation2019). Carbon black (CB) data are from the current study.