Figures & data
Table 1. Copper oxide particle concentrations and copper chloride salt concentrations expressed in terms of copper molarity, surface area of exposure, and particle specific surface area.
Figure 1. Dissolution of CuO NPs and MPs in DMEM culture medium with 2% FBS for 0–48 h. Error bars indicate one standard deviation about the mean.
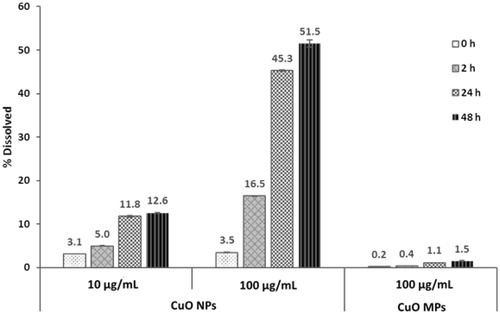
Table 2. Characterization of CuO NPs used for in vitro FE1 exposures. PDI: poly-dispersity index.
Figure 2. Trypan Blue exclusion assay results. FE1 cell viability following 2–48 h exposure to media control, CuO NPs, CuO MPs, or CuCl2. Error bars represent standard error. Significant differences between each treatment group and media control at respective timepoints were determined using a Students’ t-test (n = 4). *p < 0.05; **p < 0.01; ***p < 0.001.
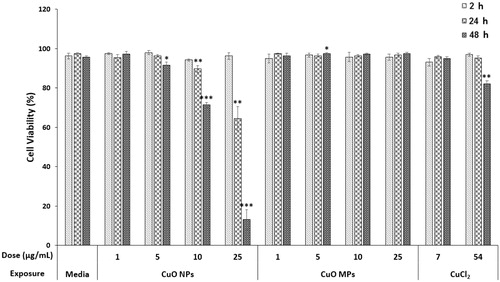
Figure 3. Number of DEGs (as compared to media controls) in FE1 cells exposed to CuO NPs, CuO MPs, and 7 µg/mL CuCl2 for 2 h, 24 h, and 48 h. A DEG is defined as having at least 1.5-fold expression change in either direction from time matched media control with a FDR p-value ≤ 0.05. Red (Left bar): Upregulated; Blue (Right bar): Downregulated. Refer to the online copy of this manuscript for the original colour version of this figure.
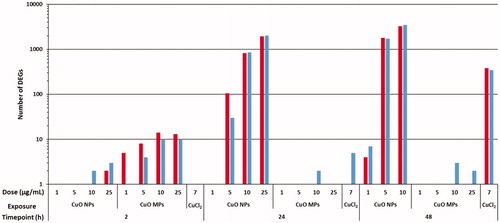
Figure 4. Top 10 most significantly perturbed IPA canonical pathways in relevant CuO NPs and CuCl2 exposed samples. If z-score ≥ 2, the pathway is unambiguously activated.
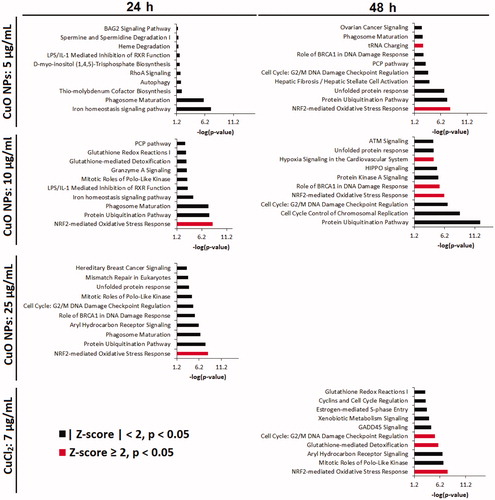
Figure 5. Heatmap of key differentially expressed genes related to 4 relevant cellular stress response pathways after exposure to 1–10 µg/mL CuO NPs or 7 µg/mL CuCl2 for 2–48 h.
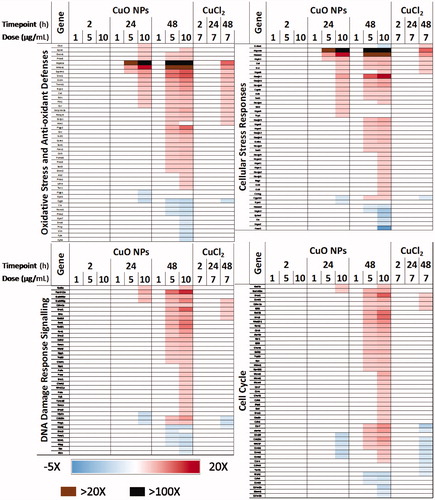
Figure 6. Heatmap of key DEGs related to the cell death pathways of apoptosis, autophagy, and necrosis. Phase contrast micrographs highlight cytoplasmic morphology after exposure to CuO NPs, CuCl2, and media control for 48 h, scale bar = 125 µm, red insets highlight representative cells.
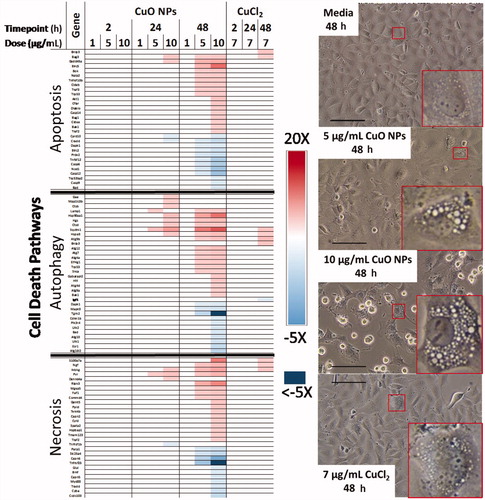
Figure 7. Proposed mode-of-action pathway built from transcriptional analysis for a minimally-cytotoxic dose of CuO NPs (5 µg/mL) (A) as compared to a relevant dose of CuCl2 (7 µg/mL) (B), and the highest dose of CuO MPs tested (25 µg/mL) (C). Labels in red within the cell indicate induced responses, for which there is pathway and gene level evidence. Squiggle represents protein aggregates. Red circles with a solid squiggle represent autophagosomes. Green solid circles represent stable lysosomes. Green dashed circles represent permeabilized lysosomes. Yellow solid circle with a dashed squiggle represents autophagolysosomes. In this model, kinetic differences in transcriptional responses are suggested to result from the CuO particle size and species-specific cellular interactions. At the time of exposure, CuO MPs have negligible or no Cu2+ species and CuO NPs exposure stock consist of ∼3% ions, whereas CuCl2 suspension is predominantly made up of Cu2+ ions. The mild and acute transcriptional responses to the highest dose of CuO MPs are transitory in nature, and are only observed sub-acutely after exposure, which is thought to be related to nonspecific interaction of large particles with the cell membrane. Lack of change in response with longer exposure duration suggests that CuO MPs are stable extracellularly and most likely will require prolonged exposure to be able to induce toxicity in whole animals or humans. In contrast, CuO NPs are rapidly internalized through nanoparticle-mediated bulk-transport mechanisms between 2 and 24 h after exposure, quickly overwhelming cellular defence mechanisms and leading to cellular injury with transcriptional disturbances in oxidative and cellular stress functions at 24–48 h. With increasing ionic concentration and overwhelmed autophagy response, leaky lysosomes can trigger cell death leading to loss of cell viability. Only a part of this response is observed in cells exposed to CuCl2 and only at 48 h of exposure. Please refer to the online copy of this manuscript for the original colour version of this figure.
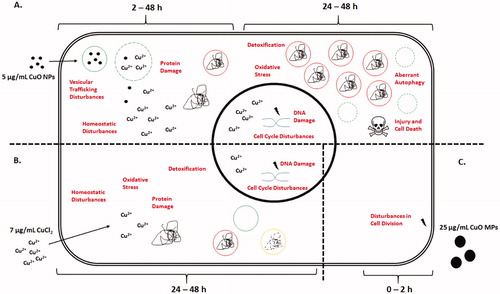
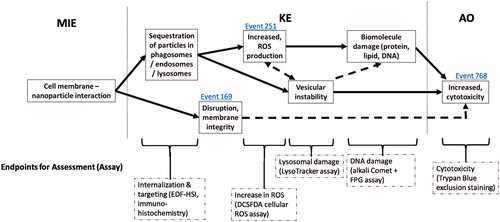
Figure 8. A proposed adverse outcome pathway for in vitro cytotoxicity relevant to MONPs. MIE: molecular initiating event; KE: key event; AO: adverse outcome. Solid arrows: adjacent key event relationship; dashed arrows: non-adjacent key event relationship. Event IDs in blue indicate a connection to a KE present in the AOPwiki. Relevant endpoints for assessment are listed, with a suggested assay for rapid screening in parentheses.