Figures & data
Table 1. Overview of recent in vivo, oral toxicity studies performed with SAS (published after June 2014), in addition to the study by van der Zande et al. (Citation2014).
Table 2. Reported mean Si (or SiO2) concentrations (mg/kg) in liver (A) and spleen (B) as a result of different dose levels of different SAS as reported in the different recent (sub)chronic animal (toxicity) studies with oral exposure.
Table 3. Concentrations of total silicon (Total-Si) and silicon particles (Si-particles) in postmortem human tissues (both measured as mg Si/kg) as reported by Peters et al. (Citation2020).
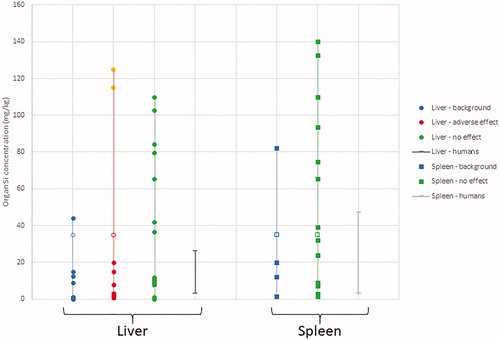
Figure 1. Concentration ranges of total-Si in liver and spleen as found in control animals from different toxicity studies (‘liver background’), in exposed animals from different toxicity studies differentiated in positive (‘adverse effect’) and negative effect levels (‘no effect’), or in human postmortem tissues (‘human background’) based on information listed in . Note that tissue concentrations reported by van der Zande et al. (Citation2014) have been converted from SiO2 to Si, and in case values were < LOD this has been indicate by an open bullet or square.