
Figures & data
Table 1. Characteristics of pristine ENM.
Figure 1. Design of feeding studies with ENM in C57BL/6J mice. In study 1, female mice from the local breeding facility were exposed to CeO2 or SiO2 until sacrificing and collection of stools on day 21. In study 2, purchased male and female mice were exposed to Ag-PVP or TiO2 P25 until sacrificing and collection of stools on day 28. Study 2 was divided into two rounds.
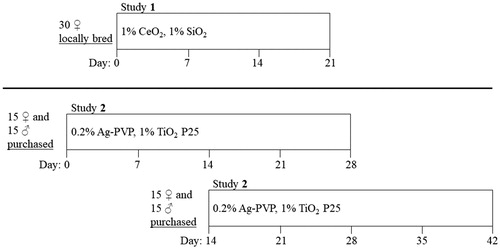
Table 2. Weekly development of the relative bodyweight in study 1, in percent of the bodyweight on the first day of exposure.
Table 3. Weekly development of the relative bodyweight in study 2, in percent of the bodyweight on the first day of exposure.
Figure 2. Weighted UniFrac distance analyses of the microbial β-diversity depicted as Principle Coordinates Analyses (PCoA). In study 1, female mice were fed with feed pellets containing either no additive, 1.0% CeO2 (A) or 1.0% SiO2 (B) (N = 10 each). All 60 animals of study 2, including two artifacts that were removed before doing further analyses, are depicted together in C. In study 2, female and male mice were fed with feed pellets containing either no additive (N = 19, 10 female and 9 male), 0.2 % Ag (D) (N = 20, 10 per sex) or 1.0% TiO2 (E) (N = 19, 10 female and 9 male). The comparison of the female control animals of study 1 and study 2 is shown in F. The different shapes of the dots represent the different cages. p Values were calculated using multivariate nested analysis of variance for study 1 and PERMANOVA based on cage average profiles for study 2.
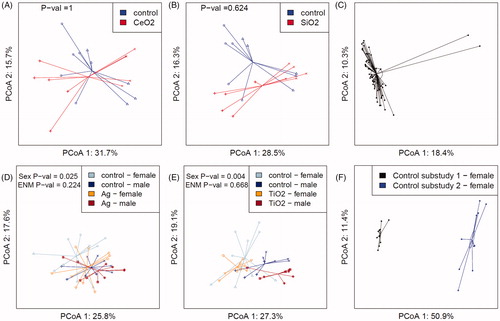
Figure 3. Abundances of phyla in the intestinal microbiome of mice after ENM exposure. In study 1, female mice were fed with feed pellets containing either no additive, 1.0% CeO2 or 1.0% SiO2 (N = 10 each). In study 2, female and male mice were fed with feed pellets containing either no additive (N = 19, 10 female and 9 male), 0.2 % Ag (N = 20, 10 per sex) or 1.0% TiO2 (N = 19, 10 female and 9 male) (A). In the scatter plots (B–D) the abundances of selected phyla in ENM exposed mice are displayed compared to the respective control. The different shapes of the dots represent the different cages. p-Values were calculated based on mixed effect models. In study 2, the interaction between sex and ENM was removed when not significant. Q Values were obtained by FDR correction. p Values ≤0.05 and Q values ≤0.10 were considered significant. E = ENM, S = Sex, f = female, m = male, C = Control, T = Treatment.
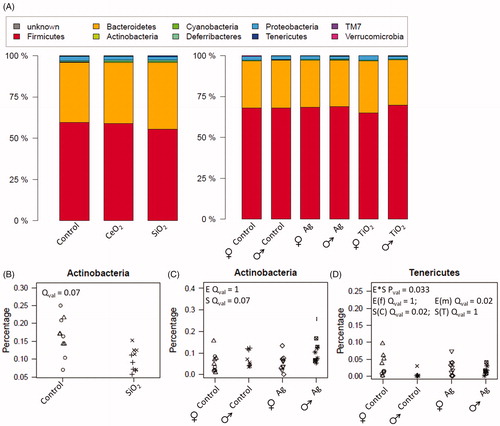
Figure 4. Abundances of genera in the intestinal microbiome of mice after ENM exposure. In study 1, female mice were fed with feed pellets containing either no additive, 1.0% CeO2 or 1.0% SiO2 (N = 10 each). In study 2, female and male mice were fed with feed pellets containing either no additive (N = 19, 10 female and 9 male), 0.2% Ag (N = 20, 10 per sex) or 1.0% TiO2 (N = 19, 10 female and 9 male) (A). In the scatter plots (B–D) the abundances of selected genera in ENM exposed mice are displayed compared to the respective control. The different shapes of the dots represent the different cages. p Values were calculated based on mixed effect models. In study 2, the interaction between sex and ENM was removed when not significant. Q Values were obtained by FDR correction. p Values ≤0.05 and Q values ≤0.10 were considered significant. E = ENM, S = Sex, f = female, m = male, C = Control, T = Treatment.
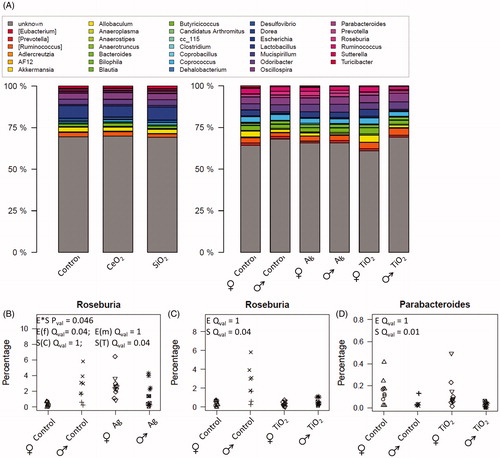
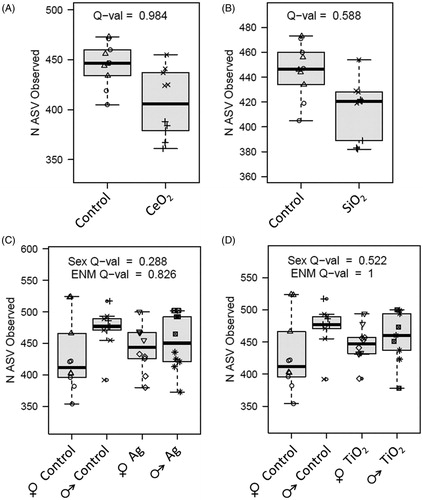
Figure 5. α-diversity of the intestinal microbiome of mice after ENM exposure. In study 1, female mice were fed with feed pellets containing either no additive, 1.0% CeO2 (A) or 1.0% SiO2 (B) (N = 10 each). In study 2, female and male mice were fed with feed pellets containing either no additive (N = 19, 10 female and 9 male), 0.2% Ag (C) (N = 20, 10 per sex) or 1.0% TiO2 (D) (N = 19, 10 female and 9 male). The richness presented as the number of ASVs observed per sample was assessed. p Values were calculated based on mixed effect models. In study 2 the interaction between sex and ENM was removed when not significant. Q values were obtained by FDR correction accounting for the three endpoints richness, Shannon entropy and Simpson's index. Q values ≤0.10 were considered significant.
Supplemental Material
Download Zip (2 MB)Data availability statement
The next generation sequencing raw data that were obtained in this investigation, are openly available in figshare at doi: 10.6084/m9.figshare.14499822.