
Figures & data
Figure 1. Tiered approach for building and justification of sets of nanoforms. Properties considered in different Tiers are listed. The expected association between Tier 2/3 properties and exposure, fate, toxicokinetics, toxicity and ecotoxicity is indicated in dark gray (strong/direct), and light gray (for weaker/indirect).
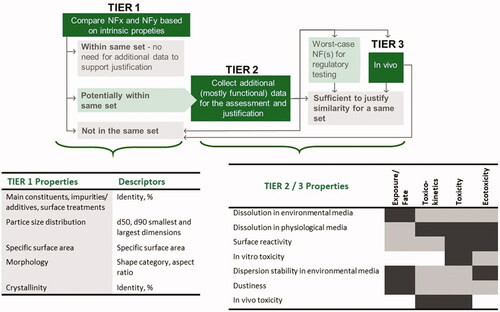
Table 1. Overview of the case studies and nanoforms included.
Table 2. Tier 1 similarity conclusions for BaSO4 nanoforms.
Figure 2. Overall conclusions for barium sulfate nanoforms. The green thumb indicates that a match was possible based on limited differences in intrinsic properties. If a Tier 2 justification had been needed, a ‘J’ would be present in the green thumb, as indicated in the legend for a justified match.
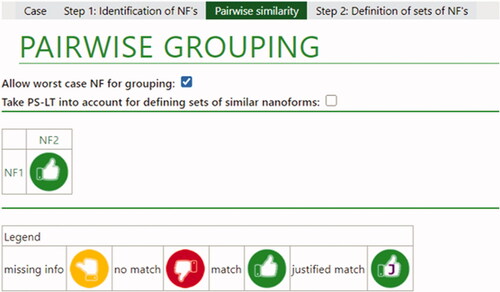
Table 3. Tier 1 similarity conclusions for colloidal silica nanoforms.
Table 4. Tier 2 similarity conclusions in relation to size and specific surface area for colloidal silica nanoforms.
Figure 3. Overall conclusions for silica nanoforms. Left: allowing worst-case NF for grouping; Right: not allowing worst-case NF for grouping. Red thumbs indicate a definite no-match. In this case, this is due to differences in size descriptors and SSA. Green thumbs with a ‘J’ indicate that a match is possible, due to the moderate differences in intrinsic properties, which do not result on relevant differences in functional properties.
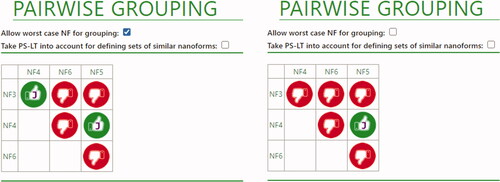
Table 5. Tier 1 similarity conclusions for ceria nanoforms.
Table 6. Tier 2 similarity conclusions for ceria nanoforms.
Figure 4. Overall conclusions for ceria nanoforms. Red thumbs indicate a definite no-match. In this case, this is due to differences in size descriptors, or results of some of the functional assays (dispersion stability and dustiness). Green thumbs (without a ‘J’) indicate that a match is possible due because Tier 1 conditions are fulfilled. Yellow thumbs indicate that a definite conclusion still depends on the data that has not been provided (in this case from functional assays).
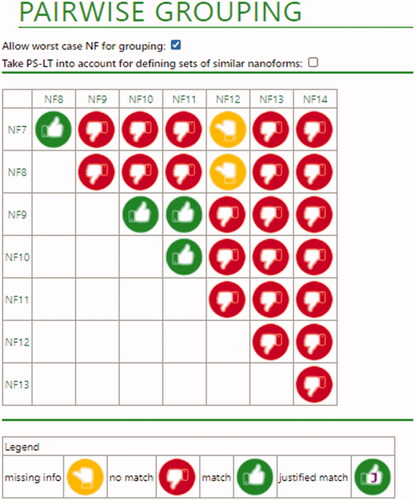
Figure 5. Illustrative screenshots on how the ECETOC NanoApp summarizes the reasons for the overall conclusions for some NF comparisons. Red thumbs on specific parameters indicate a definite no-match, whereas yellow thumbs on specific parameters indicate missing information. A) Impurities, size and specific surface area do not allow grouping of NF8 and NF14 (NFs identified in the table heading). B) Size and specific surface area do not allow grouping of NF8 and NF10, the panel on the right (blue oval) describes that environmental dispersion stability, needed to justify lack of impact of differences in size, resulted in excessive differences between NF8 and NF10. C) Size and aggregation state provisionally prevent grouping of NF7 and NF12. If missing data gaps would be addressed (i.e., dustiness for NF7, as indicated in the red box at the bottom with ‘Missing information’), such grouping might become possible.
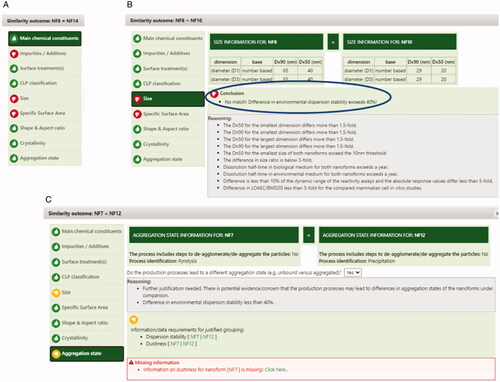
Figure 6. Comparison of changes in BALF parameters after 5 days exposure to NF8, NF12, NF13 and NF14. Effects are shown as BMCs using a logarithmic scaling. BMCs were calculated using the benchmark dose software (PROAST, proastweb.rivm.nl, Slob, Citation2002). Critical effect concentrations correspond to the following predetermined changes in the responses over the controls: 400% for PMN, 100% for total protein, LDH, GGT and ALP, and 20% for alveolar macrophages and total cell count. Evaluations 3 days (A) and 24 days (B) after the end of exposure. Data on all parameters were available for all materials at both time points, n.r. denotes the lack of a significant trend in the dataset. Total cell counts and protein levels are not included in (B) as no significant trends were found, except for a slight increase in total protein levels for NF8.
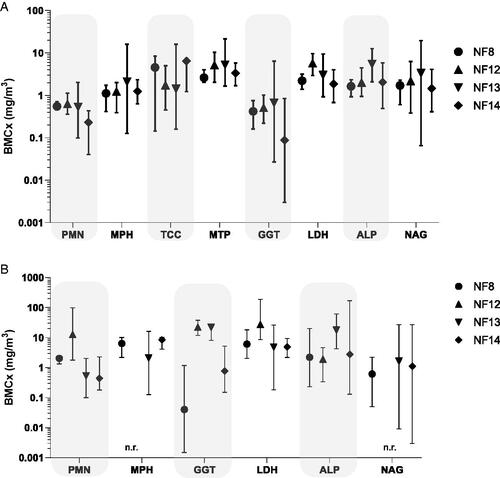
Figure 7. Overall conclusions for Pigment Blue 15:3 nanoforms. Green thumbs indicate that a match is possible due because Tier 1 conditions are fulfilled. Yellow thumbs indicate that a definite conclusion still depends on data that has not been provided (in this case from functional assays in Tier 2).
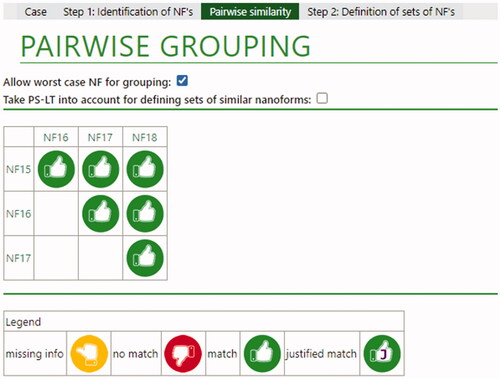
Table 7. Tier 1 similarity conclusions for Pigment Blue 15:3 nanoforms.
Table 8. Tier 2 similarity conclusions for Pigment Blue 15:3 nanoforms.