Figures & data
Figure 1. TEM micrographs of (A) NM400, (B) NM401, and (C) NM402. Scale bars: 500 nm. Refer to Table S1 for detailed characterization of the three MWCNT samples.
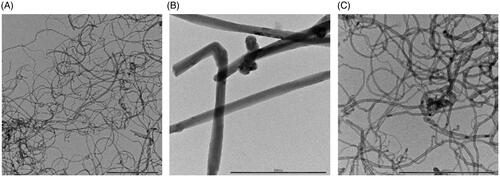
Figure 2. Cell viability assessment. Cell viability was evaluated in primary human monocyte-derived macrophages (HMDMs) (A-C) and macrophage-differentiated THP-1 cells (D–F) using the LDH assay after exposure for 24 h to NM400 (A, D), NM401 (B, E) and NM402 (C, F). Data shown are mean values ± S.D. (n = 3). **p < 0.01, ***p < 0.005. Refer to Figure S1 for corresponding results using the Alamar Blue assay.
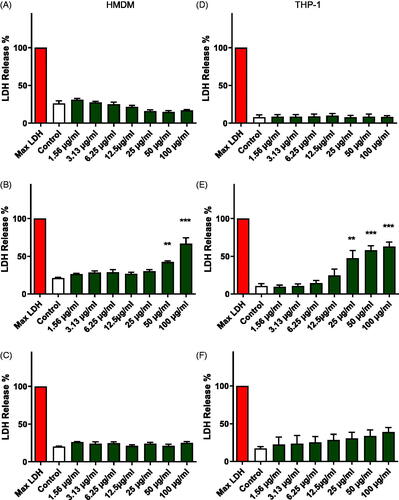
Figure 3. Cell viability assessment. Cell viability was evaluated in primary human polymorphonuclear neutrophils (PMNs) (A–C) and neutrophil-differentiated HL-60 cells (D–F) using the LDH assay after exposure for 24 h to NM400 (A, D), NM401 (B, E) and NM402 (C, F). Data shown are mean values ± S.D. (n = 3). Refer to Figure S1 for corresponding results using the Alamar Blue assay.
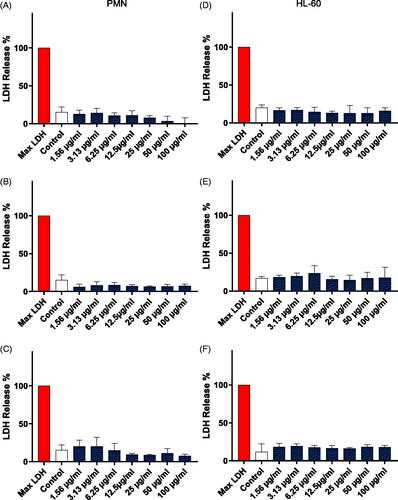
Figure 4. Cellular uptake of MWCNTs. TEM micrographs of HMDMs exposed for 24 h to MWCNTs (10 µg/mL). (A,B) NM400, (C,D) NM401, (E,F) NM402. Scale bars: 1 µm, 500 nm, and 100 nm, as indicated. Arrows in (B) point to individual MWCNT fibers; arrows in (F) point to a tangled agglomerate of fibers. Panel (D) shows NM401 penetrating intracellular membranes. Refer to Figure S3 for light microscopy of HMDMs, and to Figure S7–S9 for results on adherent versus non-adherent neutrophils.
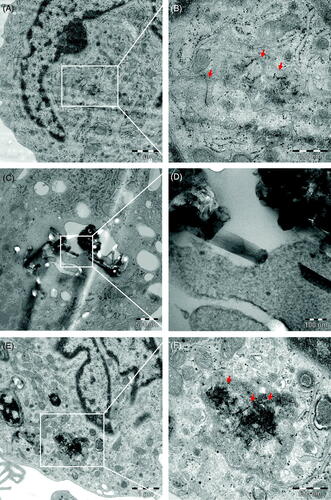
Figure 5. Inflammasome activation. (A) Cytokine production was assessed in HMDMs and THP-1 cells exposed to MWCNTs (25 µg/mL) for 24 h using the V-PLEX Human Pro-inflammatory Panel 1 Human Biomarker 10-Plex assay (MSD). As positive control, cells were exposed to 0.1 μg/mL LPS. Hierarchical cluster analysis was performed. Each branch in the dendrograms shows the similarity between samples: the shorter the branch, the more similar the samples. Association clusters for exposures and cytokines are represented by dendrograms at the left and at the top of the heat map, respectively. Refer to Figure S4 for the corresponding results in PMNs and HL-60 cells. (B) IL-1β expression was assessed by ELISA in supernatants collected from THP-1 cells exposed to NM401 in the presence or absence of the pan-caspase inhibitor, zVAD-fmk, or the NLRP3 inhibitor MCC950. As positive control, cells were exposed to 0.1 μg/mL LPS. (C) THP-1 cells exposed to NM401 in the presence or absence of the caspase-1 inhibitor, YVAD-cmk, or the cathepsin B inhibitor, CA-074. (D) IL-1β expression was assessed by ELISA in supernatants collected from THP-1 cells exposed to NM402 in the presence or absence of the pan-caspase inhibitor, zVAD-fmk, or the NLRP3 inhibitor MCC950. (E) THP-1 cells exposed to NM402 in the presence or absence of the caspase-1 inhibitor, YVAD-cmk, or the cathepsin B inhibitor, CA-074. Data in (B-E) are mean values ± S.D. (n = 3). *p < 0.05, **p < 0.01, ****p < 0.001.
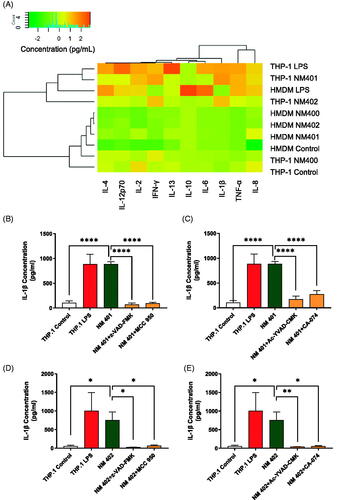
Figure 6. Long and rigid MWCNTs (NM401) trigger pyroptosis. Cell viability was assessed using the LDH assay in macrophage-like THP-1 cells exposed to the indicated MWCNTs in the presence or absence of the caspase inhibitor, zVAD-fmk (A), or the cathepsin B inhibitor, CA-074 (B). Data shown are mean values ± S.D. (n = 3). *p < 0.05, **p < 0.01. (C) Western blot analysis of gasdermin D and the C-terminal cleavage product of GSDMD in cells exposed to NM401 (25 µg/mL) ± zVAD-fmk (20 µM).
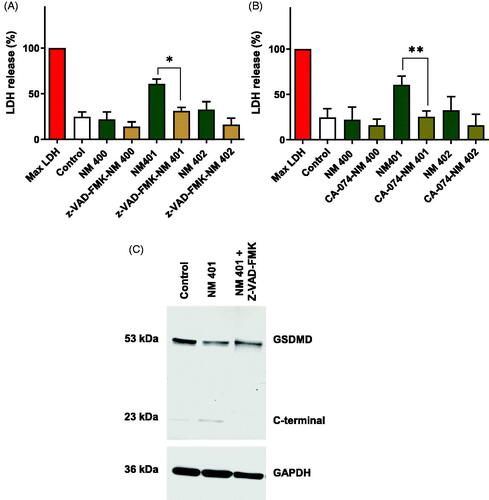
Figure 7. Long and rigid MWCNTs (NM401) trigger cathepsin B release. (A) Macrophage-differentiated THP-1 cells were exposed to MWCNTs (25 µg/mL) for 24 h and the release of cathepsin B was determined using Magic Red™, a cathepsin B substrate. (B) Representative confocal microscopy images confirmed the expression of cathepsin B in unexposed cells. Nuclei were counterstained with DAPI. Scale bars:10 µm. Refer to Figure S5 for the corresponding results in neutrophil-like HL-60 cells.
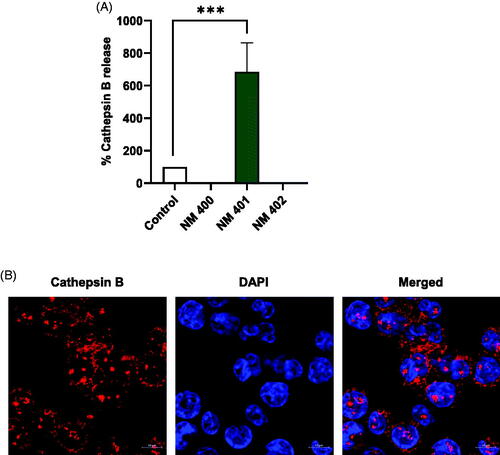
Figure 8. Gasdermin D-dependent IL-1β release. (A) THP-Null 1 (wild-type) and THP1-KO-GSDMD cells were differentiated with PMA and exposed to NM401 at 25 µg/mL for 24 h. IL-1β release was determined by ELISA. (B) THP-1 cells were exposed to NM401 at 25 µg/mL for 24 h in the presence or absence of disulfiram (DFM) (30 µM). Nigericin was added to LPS-primed cells used as a positive control. Data shown in (A) and (B) are mean values ± S.D. (n = 3). **p < 0.01, ****p < 0.001, ##p < 0.01, ####p < 0.001.
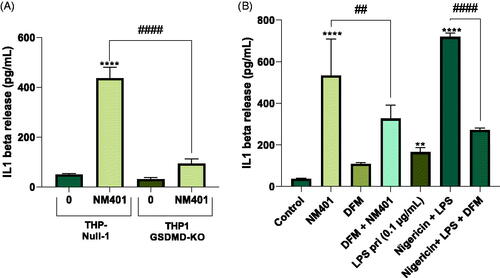
Figure 9. Pyroptosis in primary macrophages. (A) HMDM were primed or not with LPS (0.1 µg/mL) as indicated and then exposed to NM401 (25 µg/mL) in the presence or absence of the caspase-1 inhibitor, YVAD-cmk, the NLRP3 inhibitor MCC950, or the cathepsin B inhibitor, CA-074. IL-1β production was assessed by ELISA. (B,C) HMDMs primed with LPS were exposed to NM401 (25 or 50 µg/mL) and the impact of YVAD-cmk on cell death (B) and IL-1β production (C) was determined. Data shown are mean values ± S.D. (n = 3). **p < 0.01, ***p < 0.005, ****p < 0.001, ##p < 0.01, ####p < 0.001.
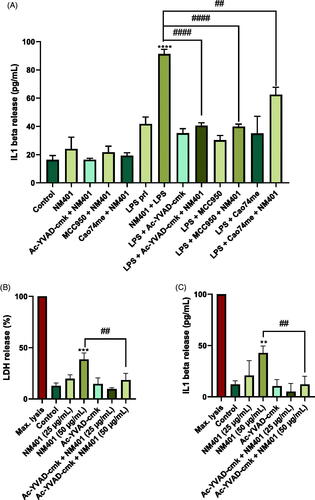
Figure 10. Autophagic cell death is dose-dependent. (A) Macrophage-like THP-1 cells were exposed to NM400, NM401, or NM402 at 50 μg/mL for 24 h in the presence or absence of the autophagy inhibitor, wortmannin, or the caspase inhibitor, zVAD-fmk, or both. Cell death was determined using the LDH release assay. (B) THP-1 cells were exposed to NM401 (25 or 50 µg/mL) and the impact of YVAD-cmk on cell death was determined. Data are mean values ± S.D. (n = 3). ***p < 0.005, ****p < 0.001, #p < 0.05, ####p < 0.001. Refer to Figure S6 for results on autophagy in RAW-Difluo™ mLC3 cells.
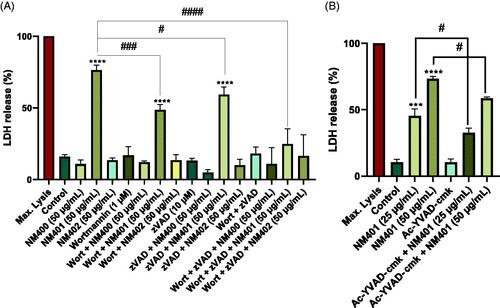
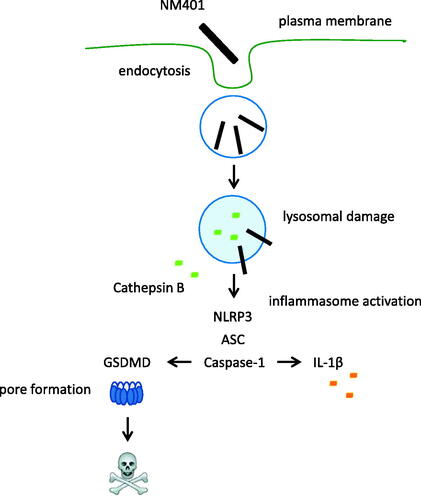
Figure 11. Schematic representation of pyroptosis induction by long and rigid MWCNTs. Refer to main text for a discussion. The present study has also provided evidence for autophagic cell death in conjunction with pyroptosis at high doses of NM401 (not shown).