
Figures & data
Figure 1. Mechanisms of mitochondrial dysregulation after aluminum nanoparticle exposure. The hypothesized mechanism (A) shows the different routes of uptake and the possible pathway of aluminum nanoparticle toxicity to mitochondria. Steps along the pathway are denoted within the figure that visualize the step in the pathway. TEM micrographs of aluminum nanoparticles (B) show an average size of around 92.2 nm with different sizes due to agglomeration. Table (C) reports the physicochemical properties of the aluminum nanoparticles as a dry powder, as a particle suspension in ultrapure water, and as a particle suspension in DMEM/F-12 (i.e. the cell culture media used in these studies). In ultrapure water and culture media, the dispersity index indicates that the nanoparticles are disperse with an average hydrodynamic diameter of 455 nm and 1340 nm, respectively. The zeta potential of 8.44 mV in ultrapure water and 1.89 mV in culture media is indicative of particle instability in suspension. The purity of the nanoparticles was confirmed via ICP-MS to be 99.99% pure aluminum. Scale Bar = 100 nm.
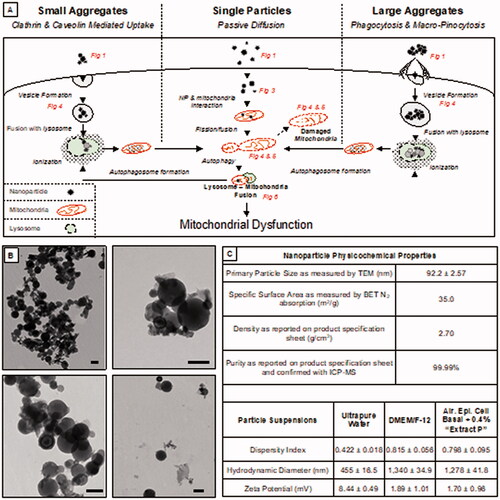
Figure 2. Characterization of mitochondrial morphology in untreated primary, cancer, and asthma lung cell types. TEM micrographs visualizing the typical baseline morphology of mitochondria are shown for (A) primary, (B) cancer, and (C) asthma cell types. The micrograph shows representative mitochondria with arrows indicating the unique morphologies seen in each cell type. Mitochondrial roundness (length and width ratio) is displayed through histograms (D) and corresponding boxplot (E). Compared to the primary cells, mitochondria in the cancer cells tend to be rounder while asthma cells have elongated mitochondria. Mitochondrial length is also displayed as a histogram (F) and boxplot (G). Compared to the primary cell type, mitochondria in cancer cells have a longer diameter and mitochondria in asthma cells have a longer diameter than the cancer cell type. *p ≤ 0.05; ****p ≤ 0.0001 versus control (primary cell type). The symbols above the box plots (i.e. circles, squares, and triangles) represent outliners as defined by the Tukey method. Scale bar = 500 nm.
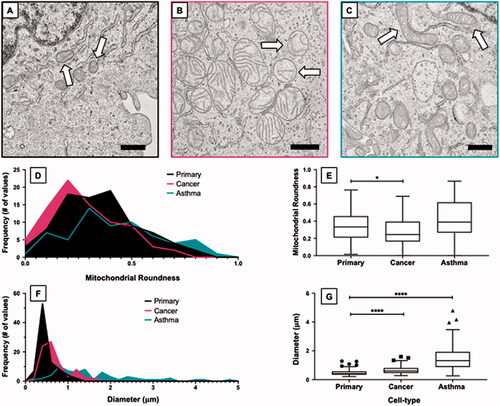
Table 1. Statistical analysis of mitochondrial size and shape among different cell types.
Figure 3. Confirmation of aluminum nanoparticle intracellular internalization. Enhanced Dark-field microscopy was used to determine a region of interest (ROI) in all three cell lines (A–C). Hyperspectral imaging is presented (D–F) as spectra from aluminum nanoparticles exposed to the cells. From this data we can confirm the uptake of aluminum into the cells and be able to understand its phase and quantity. Aluminum in primary and asthma cells seem to be a mixture of discrete and agglomerated particles, at 520 and 720 nm, respectively. There is a Gaussian-like distribution between the wavelengths indicating that there are multiple forms. Aluminum in the cancer cells contains more agglomerated particle forms due to the right shoulder.
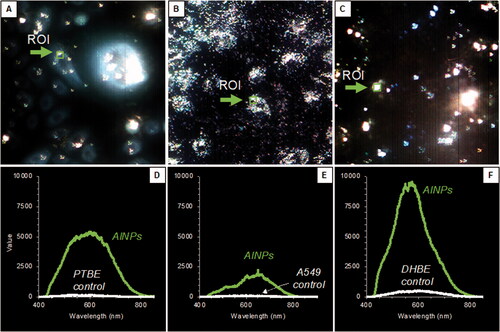
Figure 4. Morphological changes in mitochondria among aluminum nanoparticle treated cell types. TEM micrographs visualizing morphology of mitochondria after exposure to aluminum nanoparticle are shown for (A) primary, (B) cancer, and (C) asthma cell types. The arrows in each image point to characteristic changes in each cell. Primary cells experience an increase in membrane bound vesicles and elongated mitochondria. Cancer cells have decreased cristae integrity and the presence of lipid bodies. Asthma cells have an increase in membrane bound vesicles and decrease in the size of mitochondria. Mitochondrial roundness is displayed through histograms (D) and corresponding boxplot (E). Compared to the primary cells, mitochondria in each cell type cluster around the same shape with the primary cells having an increase in elongated mitochondria. Mitochondrial length is also displayed as a histogram (F) and boxplot (G). Compared to the primary cell type, mitochondria in cancer cells have a slightly longer diameter and mitochondria in asthma cells have a longer diameter than the cancer cell type. *p ≤ 0.05; ***p ≤ 0.001 versus control (Primary cell type). The symbols above the box plots (i.e. circles, squares, and triangles) represent outliners as defined by the Tukey method. Scale bar = 500 nm.
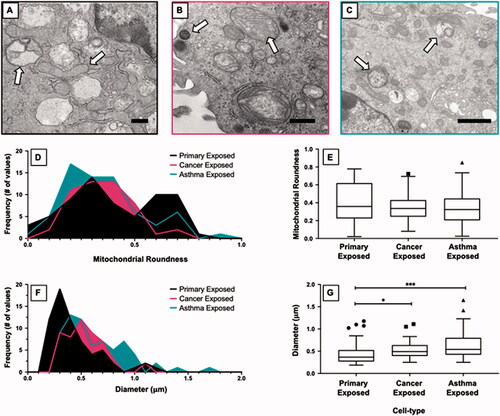
Figure 5. Cross comparisons within each cell type before and after aluminum nanoparticle exposure. Comparisons between the mitochondrial roundness of each cell type is shown as a box plot (A) and histograms (C). The primary and cancer cells both experienced a shift toward slightly more elongated mitochondria compared to their baseline while the asthma cells experienced a shift toward more circular mitochondria. Comparisons between the length of mitochondria in each cell type is shown as a box plot (B) and histograms (D). In general, each cell type experienced an overall decrease in the length of their mitochondria with the cancer and asthma cells experiencing the largest decreases. **p ≤ 0.01; ***p ≤ 0.001; ****p ≤ 0.0001 versus control (Primary cell type). The symbols above the box plots (i.e. circles, squares, and triangles) represent outliners as defined by the Tukey method.
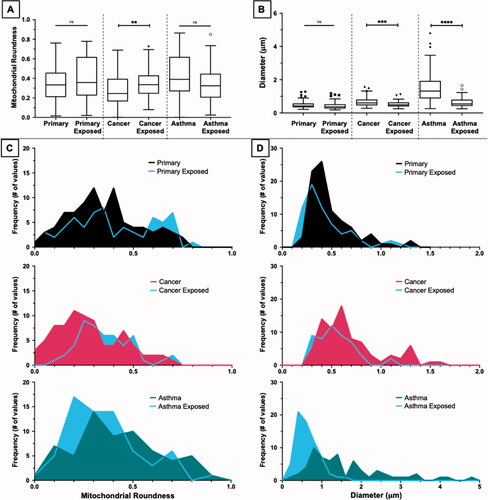
Table 2. Statistical analysis of mitochondrial size and shape before versus after aluminum nanoparticle exposure among different cell types.
Figure 6. Colocalization of lysosomes and mitochondria. Fluorescent images of primary, cancer, and asthma cells before and after exposure to AlNPs (1 ppm; 1.6 × 1 0 −7 µg/cell) were captured to compare the overlap of the mitochondrial and lysosomal dyes. Scatterplot data from colocalization analysis as well as M1 and M2 values are also shown (A). The blue dye (Hoechst 33342) stains the nucleus, the red dye (MitoTracker Red CM-H2Xros) accumulates in mitochondria, and the green dye (CellLight Lysosomes-GFP) is transduced into the cell and targets lysosomal associated membrane protein 1 (LAMP1). The bright white color represents the areas in the cell where the green (lysosomes) and red (mitochondria) dye colocalize in the cell above the set threshold. These overlap coefficients before and after exposure are visualized in the graph (B). Before exposure small amount of colocalization occur in each cell type with the asthma cells having a small amount of colocalization before exposure. After exposure colocalization increases in the primary and asthma cells while cancer cells do not experience a significant increase. Scale bar = 20 µm.
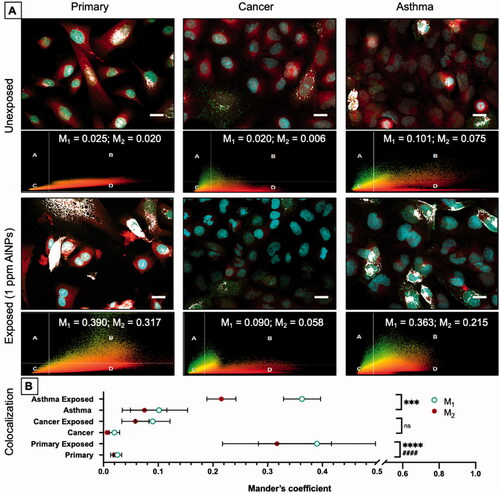
Table 3. Linking morphological changes to physiological consequences of altered mitochondrial properties.