
Figures & data
Table 1. The outline of the experimental treatment groups – 60 female mice were randomly divided at random into 12 exposure groups.
Figure 1. Cytokine production (a) IL1ß, (b) IL6, (c) IL10, (d) MCP-1 and (e) KC from liver of mice following IV, IT or oral exposure of 25 or 100 µg of Ag NPs for 24 hr. The values represent mean ± SEM (n = 5) with significance indicated by *p < 0.05 and **p < 0.005.
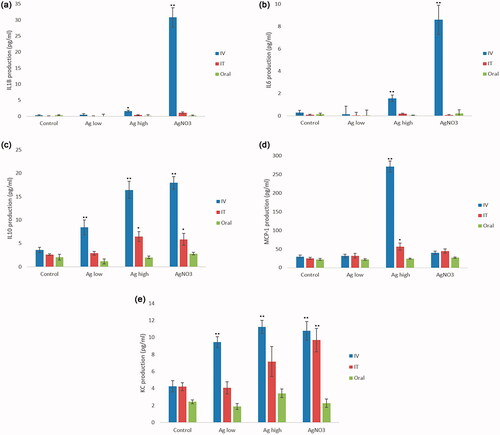
Table 2. The main primary physical and chemical properties of investigated NPs reproduced from Kermanizadeh, Pojana, et al. (Citation2013).
Table 3. Silver content in the liver, kidneys and spleen determined by HR-ICP-MS following exposure to 100 µg of NP per animal via three different routes of exposure (n = 3).
Figure 2. SAA3 levels measured in the serum of control and NP-exposed mice at 25 and 100 µg for 24 hr via IT, IV, or oral routes. The values depict mean ± SEM (n = 5) with significance indicated by *p < 0.05 and **p < 0.005.
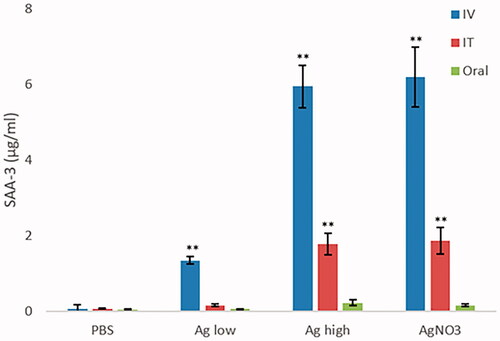
Figure 3. Reduced GSH (GSH) and total glutathione (Total GSH) measured in the (a) liver and (b) kidneys of control and Ag NPs-exposed animals at 24-hr postexposure. The values depict mean ± SEM (n = 5), significance indicated by *p < 0.05 and **p < 0.005.
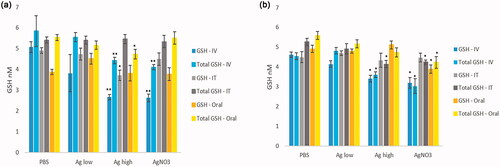
Table 4. Blood biomarkers of liver and systemic toxicity assessed in the serum of control and Ag NP (25 µg or 100 µg/per animal) exposed animals sacrificed 24-hr post-treatment following IV, IT and oral routes of exposure.
Figure 4. The alteration in the levels of liver Cx32 protein level quantified by western blot analysis of PBS or Ag NP-exposed animals sacrificed 24-hr post-treatment following IV, IT, and oral exposure. The values represent mean ± SEM with significance indicated by **p < 0.005 compared to negative control (n = 3).
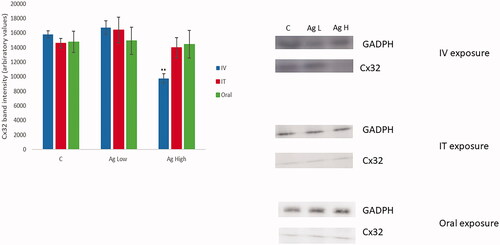
Figure 5. The histopathological examination of H and E stained liver of mice exposed to (a) control (b) high dose NPs via the IV route with damage most evident by steatosis, vacuolar degeneration, inflammatory cell influx and hepatic necrosis; kidneys of mice exposed to (c) control (d) high-dose NPs via the IV route with small influx of immune cells and from spleen of mice exposed to (e) control (f) IV exposed to high-dose NPs resulting in observation in a number of giant macrophages.
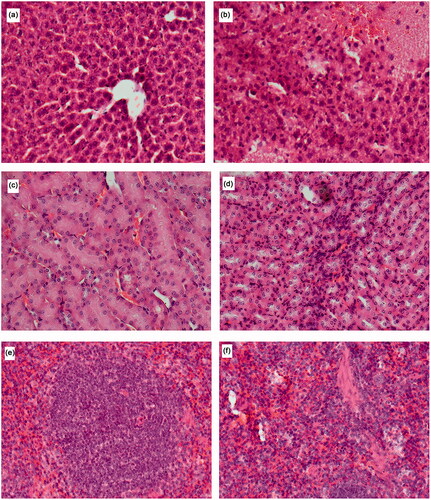
Table 5. The histological score of liver pathology from five slides from three random animals for each treatment group ranked from 0–5.
Table 6. The histological score of kidney pathology from five slides from three random animals for each treatment group ranked from 0–5.
Table 7. The histological score of spleen pathology from five slides from three random animals for each treatment group ranked from 0–5.