Figures & data
Figure 1. (A) Morphology of graphene nanomaterial in a TEM image; (B) Morphology of a PCL and PCL/G filament cross-section; yellow arrows: graphene nanomaterials in PCL/G.
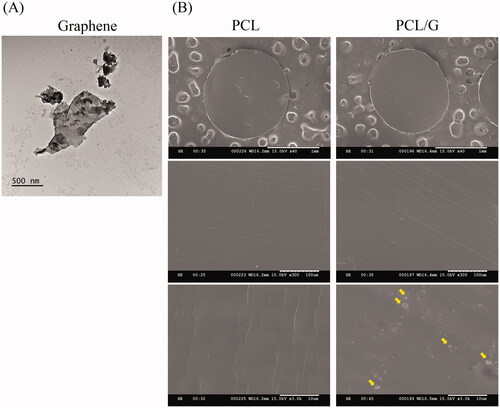
Figure 2. Fourier-Transform Infrared Spectroscopy (FTIR) spectrum analysis. (a) PCL (b) PCL/G (c) Graphene nanomaterials. Yellow arrow: increased peaks.
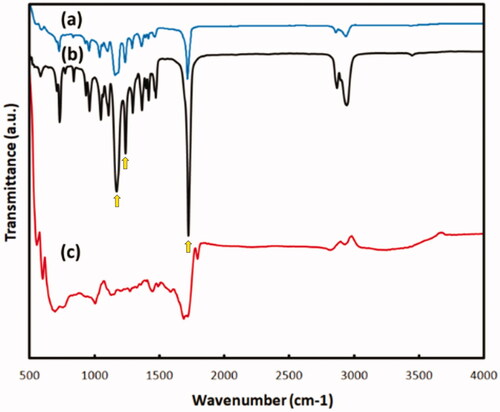
Figure 3. Micro-Raman Spectrum Analysis. (a) PCL (b) PCL/G (c) Graphene nanomaterials.
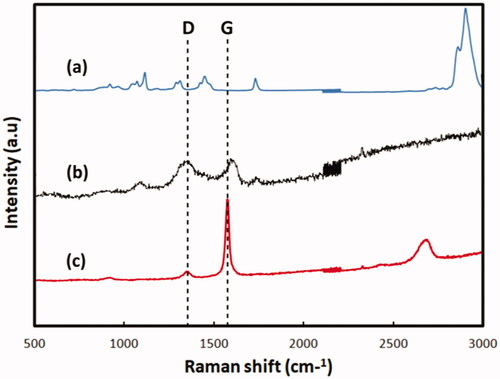
Figure 4. (A) Elastic modulus; (B) Ultimate strength; (C) Yield strain; and (D) Typical stress-strain curves of PCL and PCL/G. Mechanical strength significantly improved in the PCL/G group. *p< 0.05, ***p< 0.001 compared to PCL.
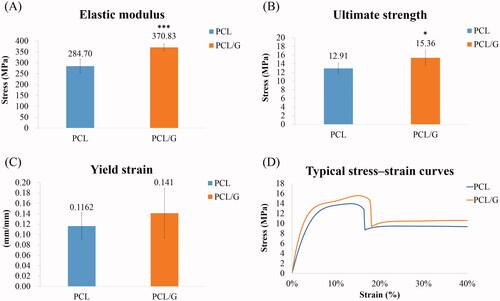
Figure 5. (A) Live/dead stain of two different cell scaffolds at 3 and 7 days. (B) WST-1 cell viability of cell scaffolds at 3 and 7 days. ***p< 0.001 compared to PCL.
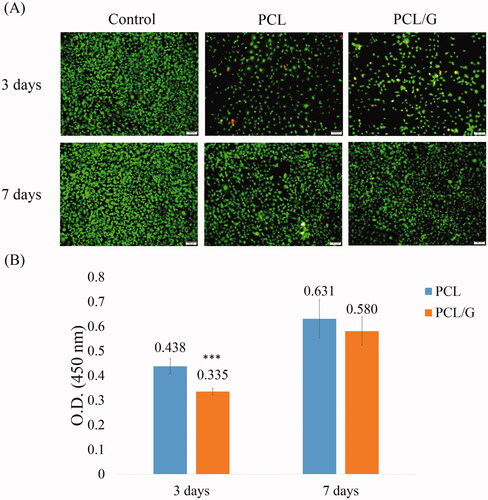
Figure 6. (A) Hair condition of the PCL and PCL/G groups on week 12. (B) Hair condition of PCL and PCL/G groups on week 18 to 60.
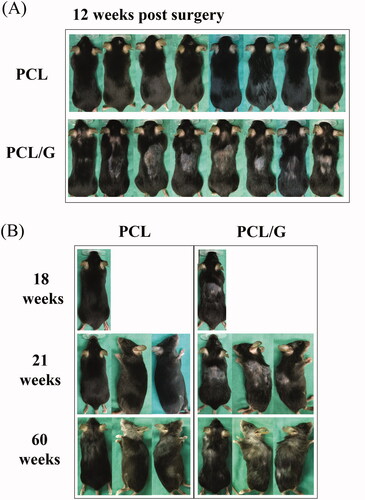
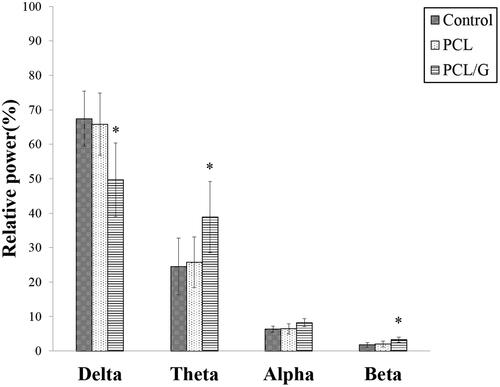
Figure 7. Four frequency bands of the relative power in the mice EEG power spectrum. *p< 0.05 compared to PCL.