
Figures & data
Figure 1. Exposure Scenarios used. An exposure of an ENM (blue arrow) is completed and analyzed at specific time points (green arrow), either after a single exposure (A.) of 24 hours (A. i), 48 hours (A. ii), or 72 hours (A. iii), or repeat exposures (B) of 48 hours (B. i) or 72 hours (B. ii). All exposures equate to the same deposited exposure concentration regardless of the exposure scenario chosen (for scenario B this is a fractionated dose which is equal to the same final concentration as A). Created with BioRender.com.
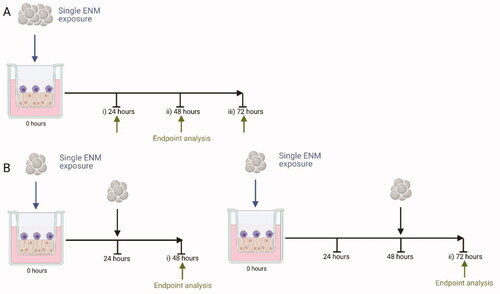
Figure 2. 24 hour single exposure of DQ12 (A and B) and TiO2 (C and D) on both A549 monocultures, A549 + dTHP-1 co-cultures, NCI-H441 mono cultures and NCI-H441 + dTHP-1 co-cultures. Cells were exposed to DQ12 for 24 hours at the ALI, before analyzing various endpoints. IL-6 (A, and C) and IL-8 (B and D) concentrations were measured in the basal compartment of the ALI culture after a single particle exposure (onto the apical side). N = 3 with all assays performed in triplicate. The data is presented as the mean ± Standard deviation. Significance is denoted as the following: compared to the medium control p < 0.01(*).
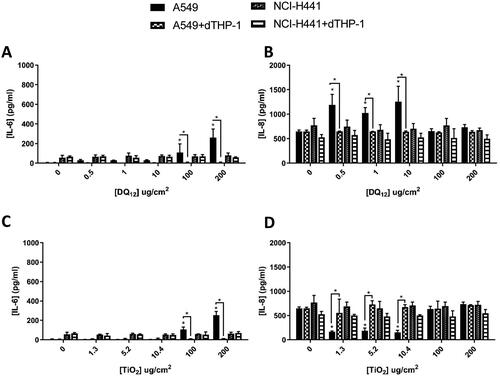
Figure 3. Micronucleus frequency (%) 24 hour post a single exposure of TiO2 or DQ12 on both A549 monocultures, and A549 + dTHP-1 co-cultures. Cells were exposed to either TiO2 or DQ12 for 24 hours at an ALI, before analyzing various endpoints. Both the monoculture (A) and the co-culture (B) were analyzed. For all CBMN assays, MMC (0.01 mg/ml) was used as a positive control. N = 3 with all assays performed in triplicate. The data is presented as the mean ± Standard deviation. Significance is denoted as the following: compared to the medium control p < 0.05(*) and p < 0.01(**).
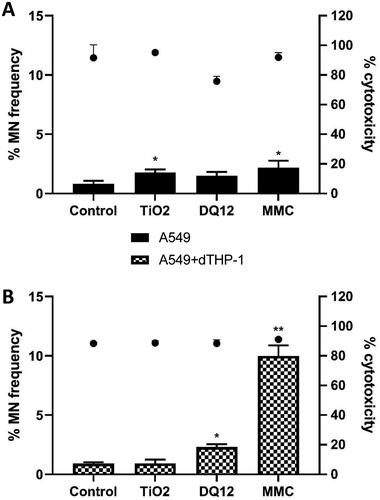
Figure 4. 24 hour single exposure of both Historic and Re-activated DQ12 on both A549 monocultures and A549 + dTHP-1 co-cultures. Cells were exposed to DQ12 for 24 hours at an ALI, before analyzing various endpoints. IL-6 (A) and IL-8 (B) concentrations were measured in the basal compartment of the ALI culture after a single particle exposure (onto the apical side). N = 3 with all assays performed in triplicate. The data is presented as the mean ± Standard deviation. Significance is denoted as the following: compared to the medium control p < 0.01(*); and compared to the Historic DQ12 p < 0.01(#).
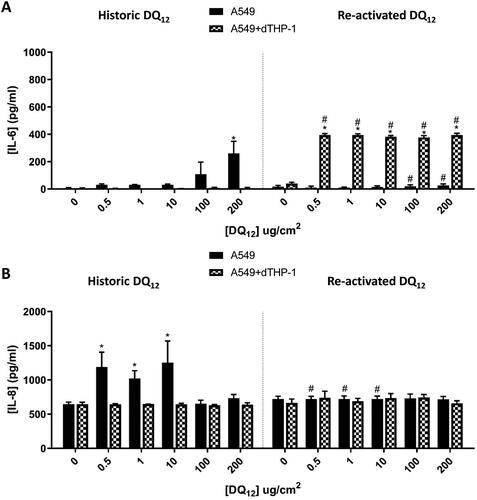
Figure 5. 48 hours (left) and 72 hours (right) single exposure of DQ12 on both A549 monocultures, and A549 + dTHP-1 co-cultures. Cells were exposed to DQ12 for either 48 or 72 hours at an ALI, before analyzing various endpoints. IL-6 (A) and IL-8 (B) concentrations were measured in the basal compartment of the ALI culture after a single particle exposure (onto the apical side). N = 3 with all assays performed in triplicate. The data is presented as the mean ± Standard deviation. Significance is denoted as the following: compared to the medium control p < 0.01(*).
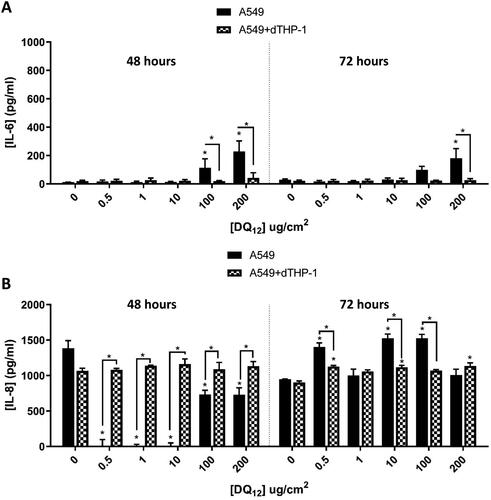
Figure 6. 48 hours single exposure of both Historic and Re-activated DQ12 on A549 + dTHP-1 co-cultures. Cells were exposed to DQ12 for 48 hours at an ALI, before analyzing various endpoints. IL-6 (A) and IL-8 (B) concentrations were measured in the basal compartment of the ALI culture after a single particle exposure (onto the apical side). N = 3 with all assays performed in triplicate. The data is presented as the mean ± Standard deviation. Significance is denoted as the following: compared to the medium control p < 0.01(*); compared to the Historic DQ12 p < 0.01(#).
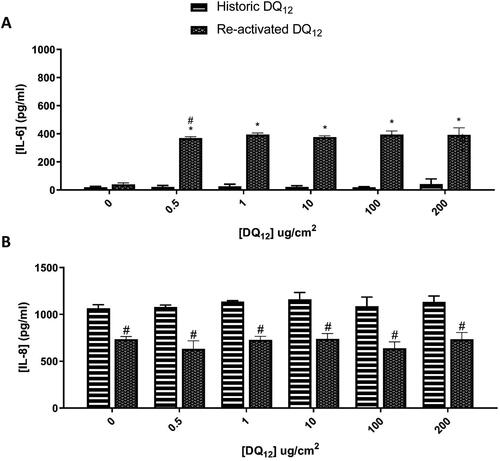
Figure 7. 48 hours (left) and 72 hours (right) repeat exposure of DQ12 on both A549 monocultures, and A549 + dTHP-1 co-cultures. Cells were exposed to DQ12 twice either over 48 or 72 hours at an ALI, before analyzing various endpoints. IL-6 (A) and IL-8 (B) concentrations were measured in the basal compartment of the ALI culture after the repeat particle exposure (onto the apical side). N = 3 with all assays performed in triplicate. The data is presented as the mean ± Standard deviation. Significance is denoted as the following: compared to the medium control p < 0.01(*).
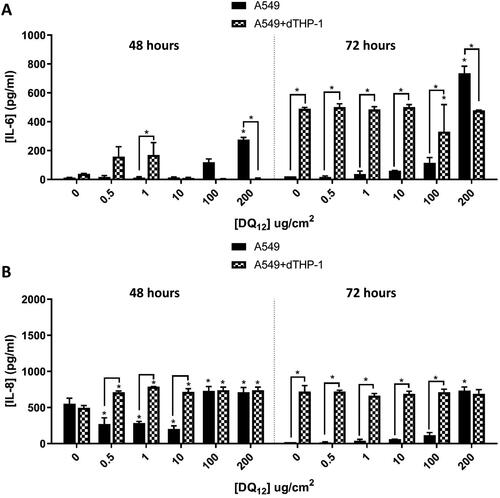
Figure 8. Micronucleus frequency (%) 48 hour post a repeat exposure of TiO2 or DQ12 on both A549 monocultures, and A549 + dTHP-1 co-cultures. Cells were exposed to either TiO2 or DQ12 repeated for 48 hours at an ALI, before analyzing various endpoints. Both the monoculture (A) and the co-culture (B) were analyzed. For all CBMN assays, MMC (0.01 mg/ml) was used as a positive control. N = 3 with all assays performed in triplicate. The data is presented as the mean ± Standard deviation. Significance is denoted as the following: compared to the medium control p < 0.01(*).
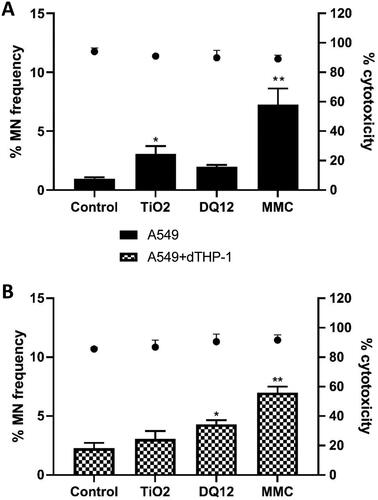
Figure 9. 48 hours repeat exposure of TiO2 (A and B) and BaSO4 (C and D) on both A549 monocultures, and A549 + dTHP-1 co-cultures. Cells were exposed to TiO2 and BaSO4 twice over 48 hours at an ALI, before analyzing various endpoints. IL-6 (A and C) and IL-8 (B and D) concentrations were measured in the basal compartment of the ALI culture after the repeat particle exposure (onto the apical side). N = 3 with all assays performed in triplicate. The data is presented as the mean ± Standard deviation. Significance is denoted as the following: compared to the medium control p < 0.01(*).
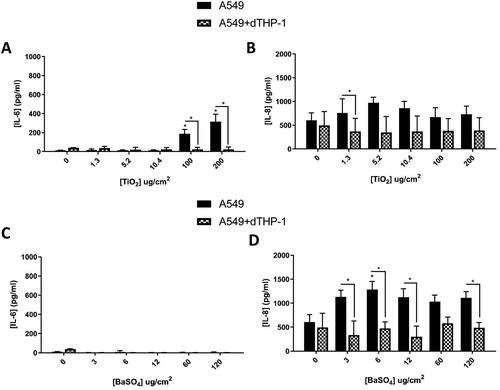
Table 1. Table Summarizing responses of each particle 24, 48 and 72 hours post exposure to a single bolus dose and 48 and 72 hours post exposure to a fractionated exposure. Arrow indicates increase (↑), no change (↔) and the significance (p < 0.01) is indicated by *.