Figures & data
Figure 1. Example of data reporting template for an ecotoxicological study, partially filled with information related to a specific study.
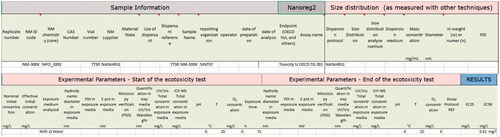
Figure 2. Details and studies for a particular material (here TiO2) in the eNanoMapper database. For this particular NM, data related to ecotoxicological studies (4 studies), physicochemical studies (157 studies) and toxicological studies (130 studies) are available. Data is structured according to the eNanoMapper data model (Jeliazkova et al. Citation2015; Kochev et al. Citation2020).
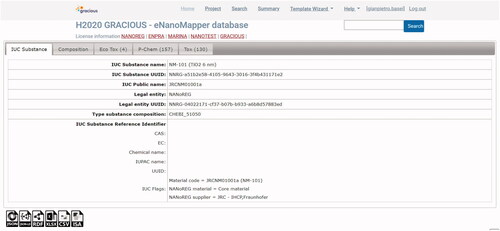
Table 1. State-of-the-art criteria for evaluating data quality and completeness.
Table 2. Comparison of the criteria for assessing reliability of in vivo data by means of the ToxRTool (Schneider et al. Citation2009) and corresponding mapping on the criteria adopted by the methodology for data quality and completeness.
Table 3. Comparison of the criteria for assessing reliability of in vitro data by means of the ToxRTool (Schneider et al. Citation2009) and corresponding mapping on the criteria adopted by the methodology for Data Quality and Completeness.
Table 4. Comparison of the criteria for assessing reliability of ecotoxicological data by means of the NanoCRED evaluation method for reliability (Moermond et al. Citation2016; Hartmann et al. Citation2017), and corresponding mapping on the criteria adopted by the methodology for data quality and completeness.
Table 5. Proposed setup for the selected criteria.
Table 6. Results of applying the methodology to publicly available data in eNanoMapper related to JRCNM03000a (NM-300K, Ag 16.7 nm). Overall completeness and quality scores for the studies are highlighted in bold. The traffic light indicator (last row of the table) highlights both the 'traffic light' and the corresponding meaning (i.e., 'green light' for data of high quality, 'yellow light' for data of sufficient quality, and 'red light' for data of insufficient quality).
Figure 3. Aggregate CSs related to physicochemical characterization of the selected data for the second case study (i.e. genotoxicity in vitro). Scores have been classified using the thresholds defined in Section 3.2.5 for the traffic light system into four categories (i.e. ‘No data,’ ‘Incomplete data,’ ‘Sufficiently complete data,’ and ‘Highly complete data’).
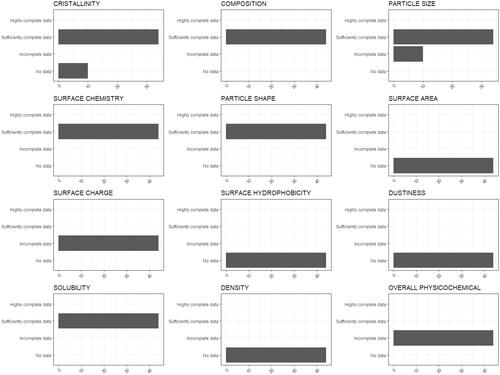
Figure 4. Aggregate CSs related to the overall physicochemical characterization, the toxicological test, and the overall CS for physicochemical data of the selected data for the second case study (i.e. genotoxicity in vitro). Scores have been classified using the thresholds defined in Section 3.2.5 for the traffic light system into three categories (i.e. ‘Incomplete data,’ ‘Sufficiently complete data,’ and ‘Highly complete data’).
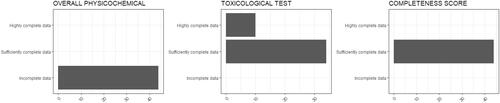
Figure 5. Results of the evaluation of data quality and completeness for genotoxicity. Two studies resulted to be of high quality, while 42 studies resulted to be of sufficient quality.
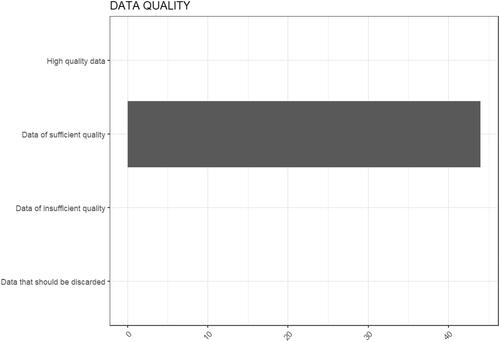
Figure 6. Implementation of the data completeness and reliability criteria in the development version of eNanoMapper. When downloading information selecting as format ‘NANoREG template,’ completeness is computed, and the completeness score is highlighted using an heatmap from red (0, data fully incomplete) to green (1, data fully complete). The numbers between parentheses in the left menu of eNanoMapper represent the total number of data points associated to each category, after application of filters. The number of substances, instead, is shown on the top of the main window.
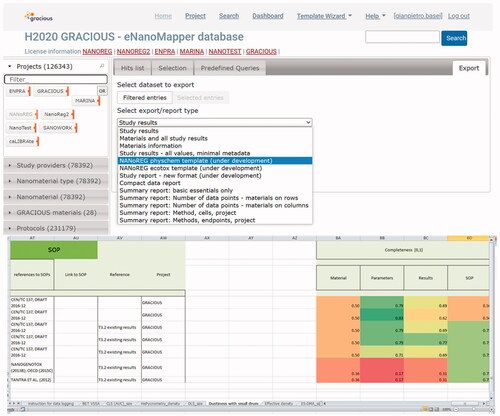
Figure 7. A list of Standard Operating Procedures is already provided in the eNanoMapper database when selecting a reporting template.
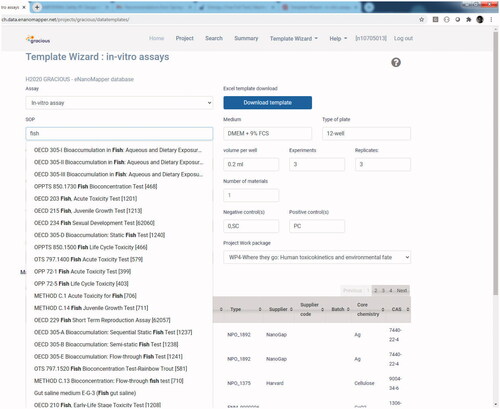
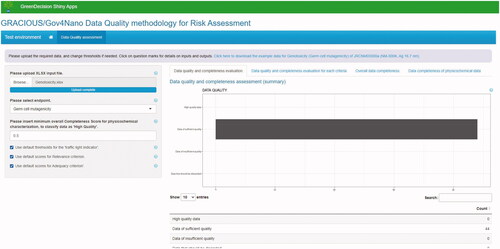
Figure 8. Screenshot of the initial version of a tool implementing the data quality assessment methodology. The results of the case study related to genotoxicity in vitro (cf. Section 3.3.2) are displayed. Currently, the tool computes data quality and completeness scores starting from the selected endpoint, the CSs of physicochemical parameters, and the classification into data reliability and adequacy categories, and then displays aggregate information on data quality and completeness of the dataset. In future versions, it will be able to directly query the eNanoMapper database.