
Figures & data
Table 1. Main physicochemical characteristics of carbon black nanoparticles included in this study.
Table 2. Effect of carbon black nanoparticle exposure on IL-8 gene induction in A549 and THP-1a cells for administered doses and effective doses quantified by TGA-MS.
Figure 1. A-cellular reactive oxygen species (ROS) production of (A) FL101, (B) P90 and (C) XE2B in the concentration range causing ROS steady increase. ROS production poorly correlated with CBNP concentration (D) (p > 0.05), whereas surface area was significantly correlated with ROS production (E) (p < 0.001 and R2:0.75). The lines represent the linear regression of ROS production as function of CBNP (D) concentration or (E) surface area.
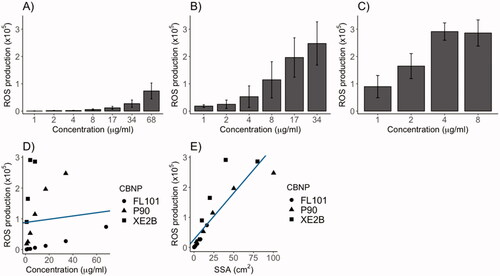
Figure 2. Pro-inflammatory response in terms of IL-8 gene expression in (A) A549 and (B) THP-1a cells exposed to FL101 and XE2B for 6 and 24 h. The data represent mean ± SEM of three independent replicates. Stars represent significance at p < 0.05 from ANOVA test of significance (*:p < 0.05:**:p < 0.01).
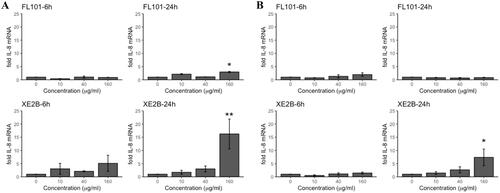
Table 3. Effects of carbon black nanoparticle exposure on DNA strand breaks levels (fold) in A549 and THP-1a cells for administered doses and effective doses quantified by TGA-MS.
Figure 3. DNA damage (% tail) in A549 (A) and THP-1a (B) cells exposed to FL101, P90 and XE2B. The data represent mean values ± SD from three independent replicates, the error bars represent the SD. Stars represent significance at p < 0.05.
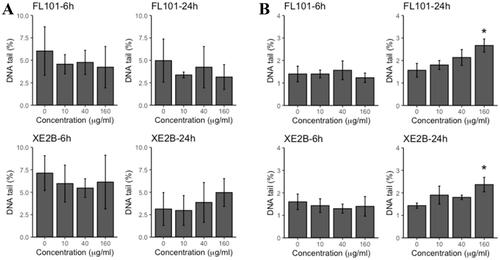
Table 4. Inflammatory cell infiltrates in broncho-alveolar lavage fluid from mice exposed to vehicle and CB nanoparticles; XE2B, FL101 and Printex 90 (P90) (positive control in this study), at day 1, 28 and 90.
Figure 4. Correlation of administered CBNP surface area with IL-8 mRNA induction in (A) A549 cells and (B) THP-1a macrophages following 24 h exposure in submerged conditions. Correlations assessed by linear regression analysis with dose and CBNP type as predictor, and IL-8 induction as outcome (p < 0.001 and R2: 0.61 in both A and B). Lines in A and B show trends with SSA dose on a logarithmic scale. C) Correlation of DNA tail (%) and administered dose as surface area in THP-1a cells (p = 0.292 and R2:0.02). (D) Correlation of DNA tail (%) and administered doses as mass in THP-1a cells (p < 0.01 and R2:0.58).
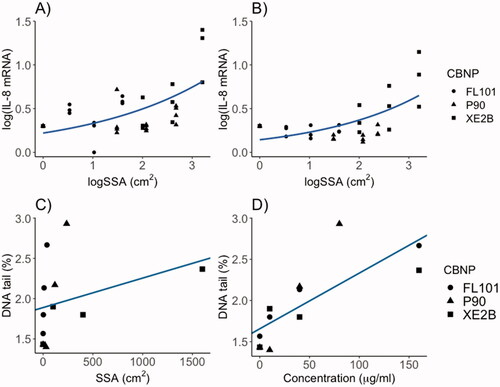
Table 5. Histological data including the numbers of lymphocyte infiltrates and macrophage aggregate separately and together.
Figure 5. Correlation of surface area with the inflammatory responses in terms of neutrophil influx in mice 1 (A), 28 (B) and 90 days post-exposure (C), by linear regression analysis with specific surface area (SSA) as predictor, and neutrophil influx as dependent variable. The data shown include data from the present study as well as previously published studies. D1: R-squared = 0.64 (p < 0.001); D28: R-squared = 0.35 (p < 0.001); D90: R-squared = 0.29(p = 0.06). Study 1: Saber et al. (Citation2015): Study 2: Kyjovska et al. (Citation2015); Study 3: Modrzynska et al. (Citation2018); Study 4: Billing et al. (Citation2020); Study 5: Barfod et al. (Citation2020); Study 6: Hadrup et al. (Citation2021); Study 7: Bourdon, Saber, et al. (Citation2012); Study 8: Poulsen et al. (Citation2016); Study 9: Bengtson et al. (Citation2017); Study 10: Hadrup et al. (Citation2020) and Husain et al. (Citation2015); Study 11: Bendtsen et al. (Citation2019); Study 12: Bendtsen et al. (Citation2020); Study 13: CBNPs tested in the present study; FL101 and XE2B.
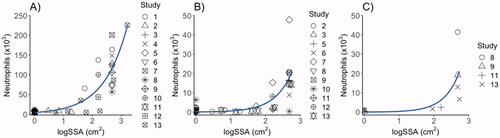
Figure 6. Histological changes in lung tissue 90 days post-exposure at 20× magnification. (A) Tissue from mouse exposed to a total carbon black surface area of 540 cm2 (corresponding to instilled mass dose of 54 ug) XE2B, (B) tissue from mouse exposed to 39 cm2 (corresponding to 162 ug) FL101. Alveolar walls in A appear widened due to capillary congestion, probably related to the euthanasia.
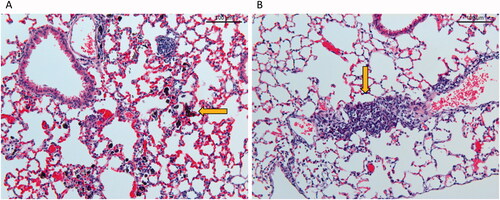
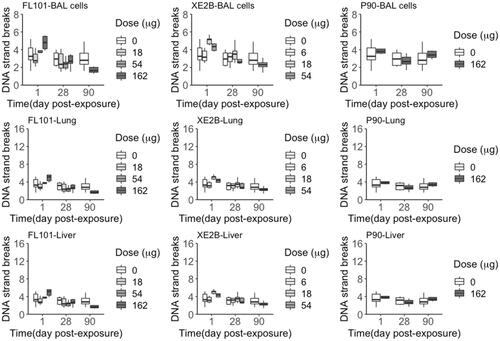
Figure 7. DNA strand breaks levels (% DNA tail) quantified in BAL cells, lung and liver tissue samples from mice exposed to the three carbon black nanoparticles for 1, 28 and 90 days (controls n = 22; exposed n = 6).
Supplemental Material
Download MS Word (61 KB)Supplemental Material
Download MS Power Point (43.8 KB)Data availability statement
Data are available upon reasonable request.