Figures & data
Figure 1. DLS size distribution by the volume of A, B, and C PS-NPs.
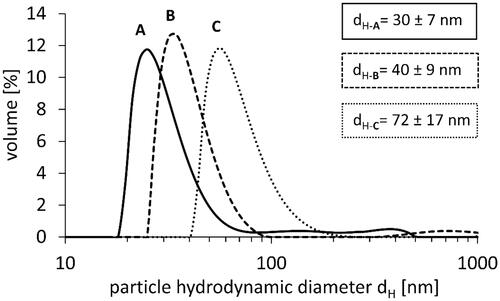
Table 1. The size of PS-NPs obtained by measurement with DLS, AFM, and SEM techniques.
Figure 2. AFM images and corresponding cross-sectional profiles of selected PS-NPs.
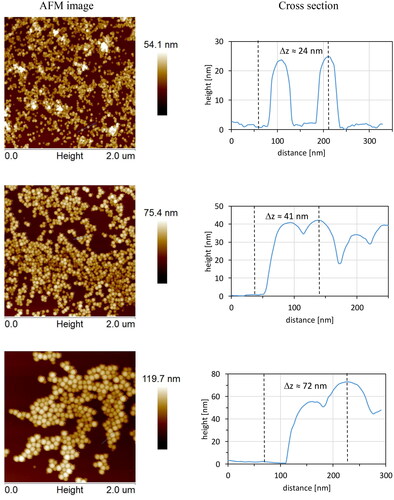
Figure 3. SEM images of nanostructures built of PS-NPs of different sizes (left column). PS-NPs size distribution (right column).
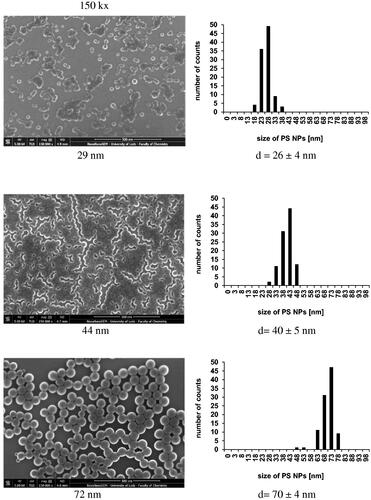
Table 2. The level of ζ-potential of PS-NPs in water and in cell medium (RPMI), pH 7.4.
Figure 4. The level of metabolic activity of human PBMCs incubated with PS-NPs of 29, 44, and 72 nm in diameter in the range of concentrations of 10–1000 µg/mL for 24 h. Statistically significant changes for p < 0.05* (n = 5).
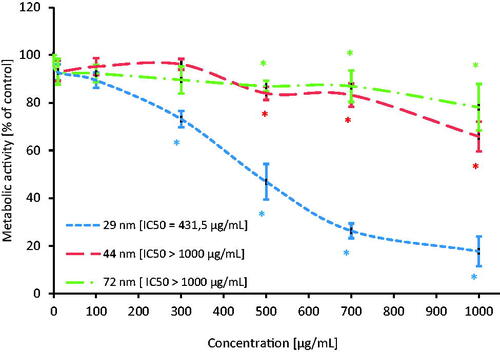
Figure 5. The level of DNA strand-breaks in human PBMCs incubated for 24 h with PS-NPs of 29, 44, and 72 nm in diameter in the range of concentrations of 0.0001-100 µg/mL. Statistically significant changes for p < 0.05* (n = 5).
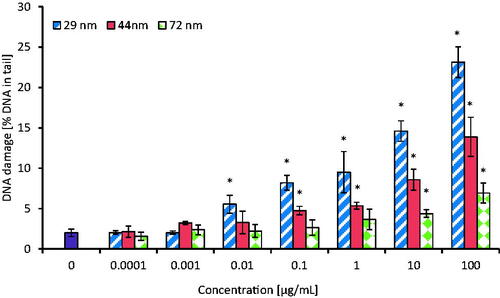
Figure 6. Selected photos showing the level of single and double strand-breaks (DNA in comet tail) in human PBMCs incubated for 24 h with PS-NPs of 29, 44, and 72 nm in diameter at two selected concentrations of 0.001 and 100 µg/mL versus the control. Photos were taken with a Zeiss Axio Scope. A1 fluorescence microscope.
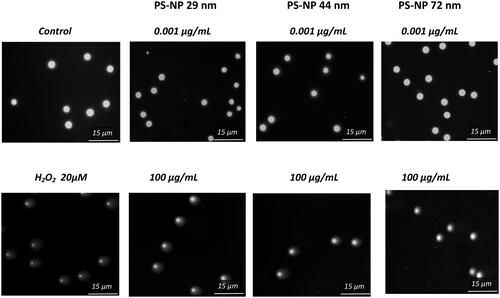
Figure 7. The level of DNA double strand-breaks in human PBMCs incubated for 24 h with PS-NPs of 29, 44, and 72 nm in diameter in the range of concentrations of 0.0001–100 µg/mL. Statistically significant changes for p < 0.05* (n = 5).
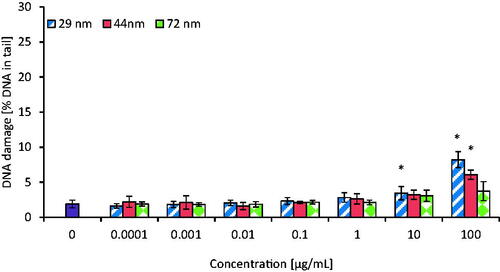
Figure 8. The level of DNA purines oxidation in human PBMCs (analysis by means of alkaline version of the comet assay with formamidopyrimidine-DNA glycosylase). The cells were incubated for 24 h with PS-NPs of 29, 44, and 72 nm in diameter in the range of concentrations of 0.0001–100 µg/mL. The value of comet tail (damaged DNA) in the presence of either enzyme for different concentrations of PS-NPs was reduced by the value obtained in comet assay without the enzyme (value for enzymatic buffer for the appropriate concentration of PS-NPs). Statistically significant changes for p < 0.05* (n = 5).
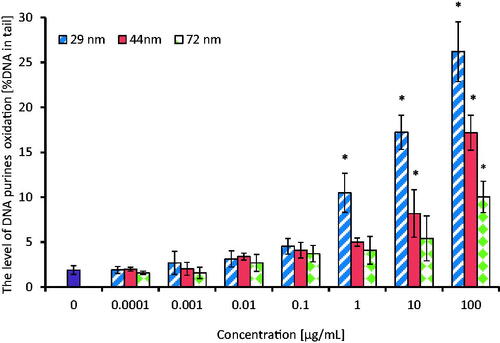
Figure 9. The level of DNA pyrimidines oxidation in human PBMCs (analysis by means of alkaline version of the comet assay with endonuclease III). PBMCs were incubated for 24 h with PS-NPs of 29, 44, and 72 nm in diameter in the range of concentrations of 0.0001–100 µg/mL. The value of comet tail (damaged DNA) in the presence of either enzyme for different concentrations of PS-NPs was reduced by the value obtained in comet assay without the enzyme (value for enzymatic buffer for the appropriate concentration of PS-NPs). Statistically significant changes for p < 0.05* (n = 5).
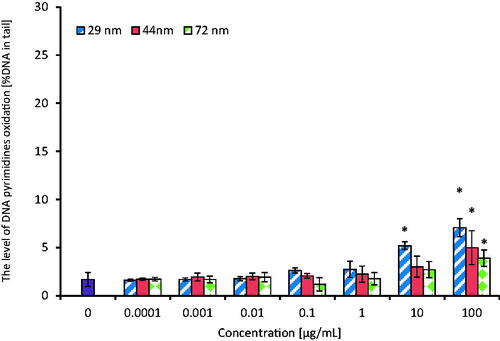
Figure 10. The level of 8-oxodG in human PBMCs. PBMCs were incubated for 24 h with PS-NPs of 29, 44, and 72 nm in diameter in the range of concentrations of 0.0001–100 µg/mL. Statistically significant changes for p < 0.05* (n = 3).
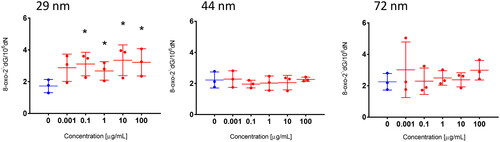
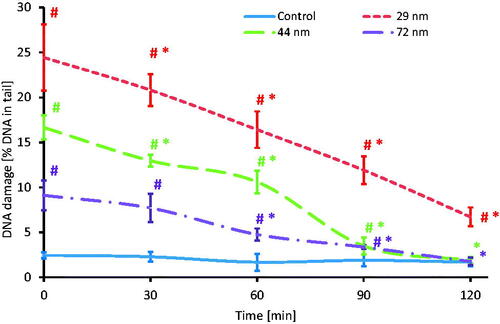
Figure 11. Time course of the repair kinetics of DNA damage (SSBs and DSBs), measured as DNA in comet tail of PBMCs treated for 24 h with PS-NPs of 29, 44, and 72 nm in diameter in the concentration of 100 μg/mL, and then post-incubated for 2 h in medium deprived of tested particles. (*) Statistically significant different from control (p < 0.05). (#) Statistically significant different from time "0" for individual PS-NPs size (p < 0.05). Each value represents the mean ± SD (n = 5).