Figures & data
Table 1. DLS data for the materials.
Figure 1. Neutrophil and total cell numbers in BAL fluid of mice exposed to the materials. ZnO or ZnO-Matrix were administered by intratracheal instillation at doses providing 0.22, 0.67, or 2 µg ZnO/mouse (n = 6/group). For Matrix, the administered volumes of coating were the same as for the ZnO-matrix. Low, mid, and high designates low dose, mid dose, and high dose, respectively. Carbon black at 162 µg/mouse (n = 6) served as positive control. Data are mean and bars represent SD. ***, **, and * designates p values of <0.001, <0.01, and <0.05, respectively, of one way ANOVA with Holm–Sidak’s multiple comparisons test in case of data approaching normality and not having a highly different variation (details given in the methods section), otherwise by Kruskall–Wallis test with Dunn’s multiple comparisons test. In the case of carbon black ****, ***, **, and * designates p values of <0.0001, <0.001, <0.01, and <0.05, respectively, vs. vehicle of the Mann–Whitney test. ### and # designate Bonferroni-corrected (6 comparisons) p values of <0.001 and <0.05 of unpaired t-test of ZnO-Matrix vs. ZnO and Matrix.
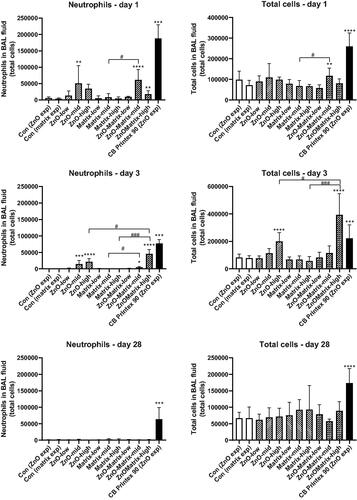
Figure 2. Examples of histological changes in the lung of mice on day 1 (A, D, G), 3 (B, E, H), and 28 (C, F, I) after intratracheal instillation with 2 µg/animal of ZnO (A–C), ZnO-Matrix (D–F), or Matrix (G–I). Asterisks: congestion. Long arrows: leukocytic infiltration in alveolar lumina and walls. Short thin arrows: proliferation of epithelial bronchiolar cells. Short thick arrows: perivascular and peribronchiolar edema. Head arrows: alveolar wall widening. V: exudate in lumen of some alveoli. HE staining, magnification as on the scale in I. An example of a normal structure of the mouse lung is presented in Supplementary Figure S2(A).
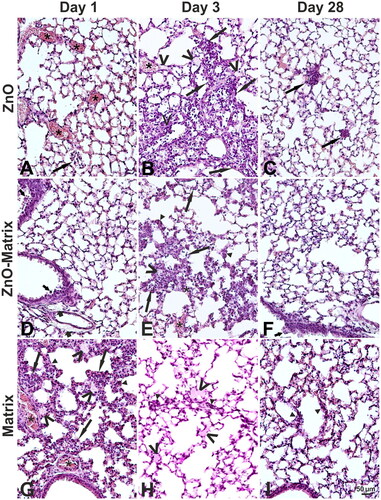
Figure 3. Examples of histological changes in the liver day of mice on 1 (A, D, G), 3 (B, E, H), and 28 (C, F, I) after intratracheal instillation of 2 µg/animal of ZnO (A–C), ZnO-Matrix (D–F), or Matrix (G–I). Long thick arrows: focal infiltration of inflammatory cells (note adjacent necrotic hepatocytes with distinct eosinophilic cytoplasm). Long thin arrows: necrotic hepatocytes (in A with eosinophilic cytoplasm, in G with pyknotic nuclei). Short thin arrows: prominent nuclei of Kupffer cells. Short thick arrows: binucleate hepatocytes. Circles: cytoplasmic vacuolation in hepatocytes. Asterisk: congestion. HE staining, magnification as on the scale in I. An example of a normal structure of the mouse liver is presented in Supplementary Figure S2(B).
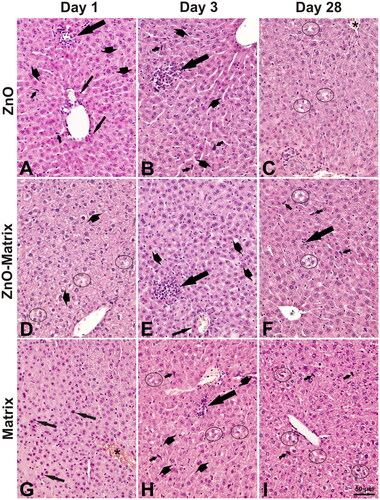
Figure 4. Levels of DNA strand breaks in lung tissue at 1, 3, and 28 d of nanoparticle exposure. ZnO or ZnO-Matrix were administered by intratracheal instillation at doses providing 0.22, 0.67, or 2 µg ZnO/mouse (n = 6/group). For Matrix, the same volumes of coating as for the ZnO-matrix were administered. Low, mid, and high designates low dose, mid dose, and high dose, respectively. Carbon black at 162 µg/mouse (n = 6) served as positive control. Data are mean and bars represent SD. ** and * designates p values of < 0.01 and <0.05, respectively, of one-way ANOVA with Holm–Sidak’s multiple comparisons test.
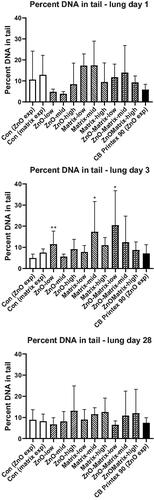
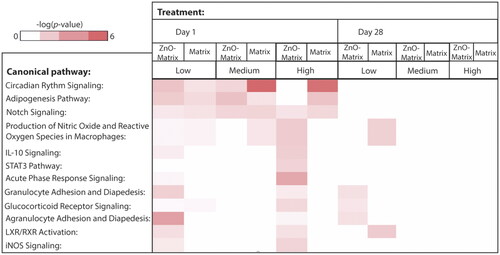
Figure 5. Canonical pathways affected in lung tissue by 1 or 28 d of ZnO-Matrix or Matrix exposure. ZnO-Matrix or Matrix was administered by intratracheal instillation at 0.22, 0.67, or 2 µg/mouse (designated: low, medium, and high). The deeper the red coloring is, the higher the effect is on the specific canonical pathway. The bare ZnO nanoparticle was not tested in this assay.