
Figures & data
Table 1. Primer list.
Figure 1. Viability of BeWo cells exposed to silver or gold nanoparticles at different concentrations. BeWo cells were treated for 48 h with (a) 0.039, 0.078, 0.156, 0.625, 1.25, or 2.5 μg/mL nAg10 or (b) 0.156, 0.625, 2.5, 10, 40, or 100 μg/mL nAu10 with or without forskolin (50 µM). Cell viability was evaluated by MTT assay. Data are expressed as means ± S.D.; (a) n = 4. (b) n = 5.
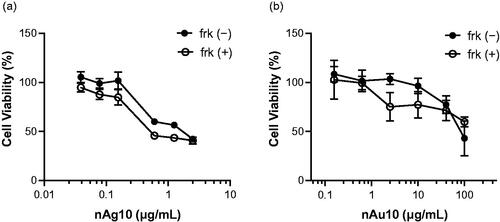
Figure 2. nAg10 suppresses forskolin-induced syncytialization in BeWo cells. (a) BeWo cells were treated with forskolin alone or with forskolin (50 µM) containing nAg10 (0.156 µg/mL), nAu10 (0.156 µg/mL), or H-89 (10 µM) for 48 h. The expression of E-cadherin and hCGβ was analyzed by immunofluorescence staining with DAPI counterstaining. Scale bars: 100 µm. (b) The rate of hCGβ positive cells to total was determined. (c) Given that each syncytial cell had two or more nuclei, the ratio of the number of syncytial nuclei to the total number of nuclei was determined as a Fusion Index. The percentage of hCGβ-positive cells and Fusion Index were quantified from images of five different fields for every two wells. The graph (b) and (c) showed that pooled result from two independent experiments. Data are expressed as means ± S.D.; *P<0.05, **P<0.01, ***P<0.001, ****P<0.0001.
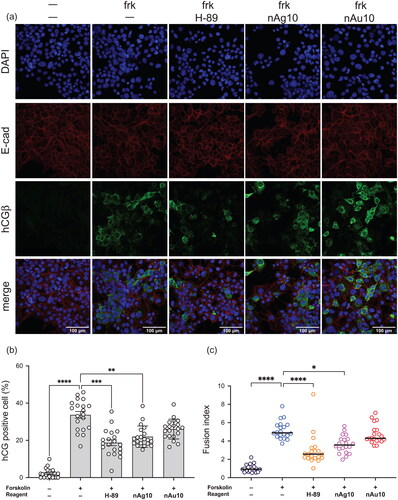
Figure 3. nAg10 suppresses syncytial marker mRNA expression and protein production in BeWo cells. BeWo cells were treated for 48 h with forskolin alone or with forskolin (50 µM) containing nAg10 (0.039, 0.078, or 0.156 µg/mL), nAu10 (0.156, 0.612, or 2.5 µg/mL), or H-89 (10 µM). The expression of (a, b) CGB and (c, d) SDC1 mRNA was analyzed by real-time reverse transcription–polymerase chain reaction. The relative expression level of each gene was analyzed after normalization to that of Actin. Data are presented as means ± S.D. of three independent experiments; *p < 0.05. The concentration of hCGβ in the culture supernatant of the (e) nAg10- and (f) nAu10-treated cells was determined by enzyme-linked immunosorbent assay. Two independent experiments were performed. Dates are presented as means ± S.D.; *p < 0.05.
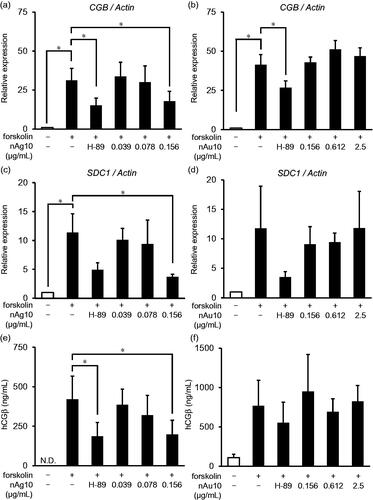
Figure 4. nAg10 decreases mRNA expression of syncytialization-promoting molecules in BeWo cells. BeWo cells were treated for 48 h with forskolin alone or with forskolin (50 µM) containing nAg10 (0.039, 0.078, or 0.156 µg/mL), nAu10 (0.156, 0.612, and 2.5 µg/mL), or H-89 (10 µM). The expression of (a, b) ERVW-1 and (c, d) ERVFRD-1 mRNA was analyzed by real-time reverse transcription–polymerase chain reaction. The relative expression level of each gene was analyzed after normalization to that of Actin. Data are presented as means ± S.D. of three independent experiments; *p < 0.05, ***p < 0.001.
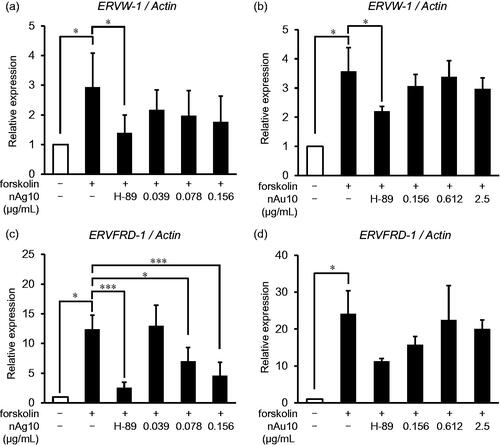
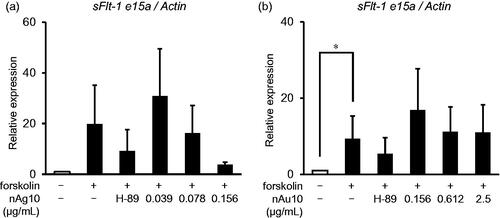
Figure 5. nAg10 decreases mRNA expression of a placental angiogenesis marker in BeWo cells. BeWo cells were treated for 48 h with forskolin alone or with forskolin (50 µM) containing nAg10 (0.039, 0.078, or 0.156 µg/mL), nAu10 (0.156, 0.612, and 2.5 µg/mL), or H-89 (10 µM). The expression of sFlt-1 e15a mRNA of the (a) nAg10- and (b) nAu10-treated cells was analyzed by real-time reverse transcription–polymerase chain reaction. The relative expression level of each gene was analyzed after normalization to that of Actin. Data are presented as means ± S.D. of three independent experiments; *p < 0.05.
Supplemental Material
Download MS Power Point (118.3 KB)Data availability statement
All data generated or analyzed during this study are included in this published article and its supplementary information files.