
Figures & data
Figure 1. TEM images of food-grade TiO2 (E171) particles. E171 powder after dispersion in ultrapure water at low (A) and high (B) magnification showing morphology of isolated and aggregated TiO2 particles.
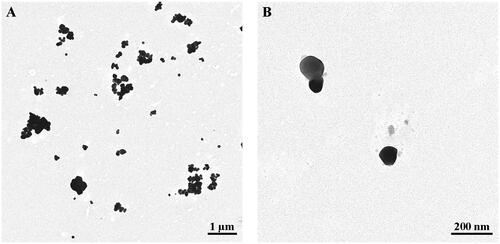
Table 1. TiO2 sample characterization by DLS.
Figure 2. TEM imaging and EDX analysis of ultrathin sections of the buccal mucosa and submandibular lymph nodes from pigs exposed to food-grade TiO2 particles (E171). (A) TEM images (A1-2) and the corresponding EDX analysis for elemental analysis (A3) of the Ti(O2) particles translocated into the buccal floor 30 min after a single E171 sublingual deposit. Note in the EDX spectrum (A3) additional Al and Si signals as main elements over an adjacent particulate deposit appearing as a chapelet (A1). Copper (Cu) and lead (Pb) are from the sample grid and lead citrate staining, respectively. (B,C) TEM images (B1-C1) and the corresponding EDX spectra (B2-C2) of the Ti(O2) particles in the buccal mucosa at 4 h, i.e., one hour after the last E171 sublingual deposit. Note in (B1) the presence of an elongated Fe particle in the same microscopic field. (D) TEM image (D1) and the corresponding EDX analysis (D2) of the Ti(O2) particles translocated into a submandibular lymph node at the same time point.
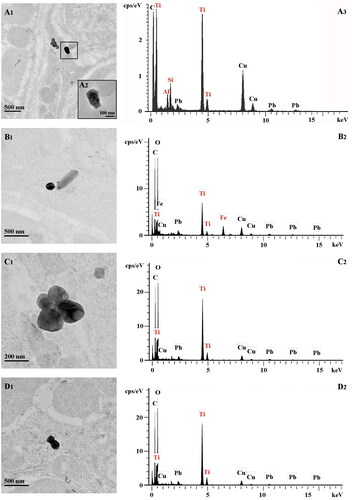
Table 2. TiO2 particles in pig buccal mucosa and submandibular lymph nodes after repeated sublingual deposition for 4 h of E171 suspension dispersed in water.
Figure 3. Absorption kinetics of buccal TR146 cells exposed to food-grade TiO2 (E171) particles. (A-D) Confocal images of TR146 cell sections treated with 50 µg/ml E171 for 1 h, 2 h and 5 h, or 2 h plus a wash-out (WO) of 5 h. The laser-reflecting (metal) particles appear green, the WGA-labelled glycoproteins appear red, and cell nuclei appear blue. (E-F) TEM images of TR146 cell sections treated with 50 µg/ml E171 for 5 h (E) and 2 h followed by a 5 h wash-out (F).
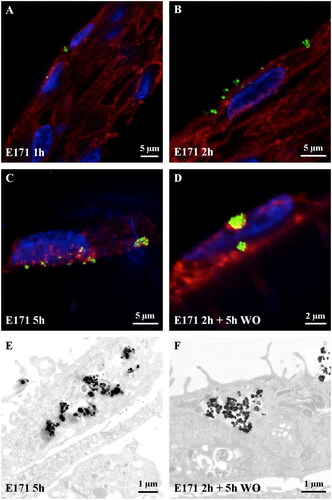
Figure 4. Correlative secondary electron (SE) imaging, scanning transmission ion microscopy (STIM) and secondary ion mass spectrometric (SIMS) elemental mapping of ultrathin sections of buccal TR146 cells exposed to food-grade TiO2 (E171) particles for 24 hours. In contrast to the TEM images presented in figure 2, SE imaging obtained with a helium ion microscope (here, npSCOPE) reveals predominantly topographical information. The thin sections therefore show only limited contrast of the cell structures and the nanoparticles are easily recognized. For TEM-like imaging, the STIM detector attached to the npSCOPE prototype device allows investigation of the transmitted beam information and highlights the NP in relation to the cellular ultrastructure. The image shows the engulfment of electron-dense particles into the cell cytoplasm. The SIMS image obtained on the same area highlights cellular information when considering the 12C14N cluster ion and clearly identifies individual TiO2 nanoparticles and clusters (lateral resolution down to a particle size of 15 nm). The integrated Ti “Σ”-map represents the signals obtained by summing the peaks of all Ti isotopes and all TiO cluster peaks.
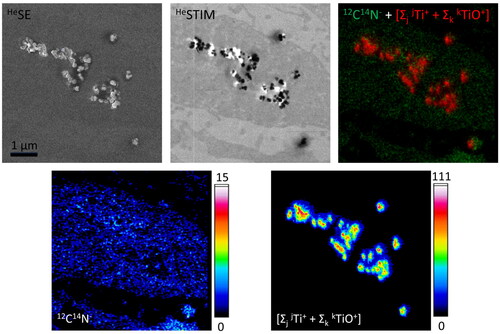
Figure 5. Cytotoxicity of the TiO2 particles in TR146 cells. Proliferating or differentiated TR146 cells were exposed to 25 µM of etoposide or different concentrations (5, 50 or 100 µg/ml) of E171, NM-102 or TiO2-NPs. (A) Cell viability was assessed using the AlamarBlue® assay. The graphs represent the viability normalized to that of untreated cells. The results are presented as the mean ± SD of at least three independent experiments. Statistics were calculated by two-way ANOVA followed by Dunnett’s multiple comparison test. (B) The TEER was determined in differentiated TR146 cells at different time points after exposure to the TiO2 materials. The results are presented as the mean ± SD of three independent experiments.
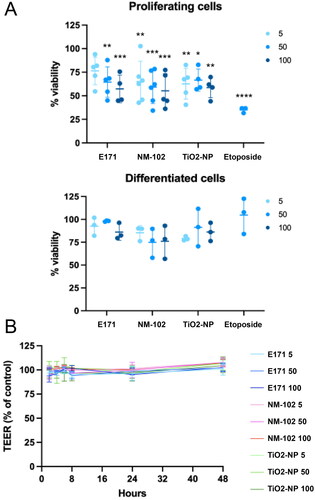
Figure 6. Genotoxicity of the TiO2 particles in TR146 cells. (A) TR146 cells were left untreated (NT) or exposed to 50 µg/ml E171, NM-102 or TiO2-NPs for 2 h and analyzed by immunofluorescence microscopy with antibodies against γH2AX and 53BP1. The images on the right represent magnification of the cells delineated by squares with white dotted lines (γH2AX and 53BP1 signals). (B, C) Proliferating TR146 cells were treated with 50 µM of etoposide or different concentrations of TiO2 (5, 50 or 100 µg/ml), and the γH2AX signal was quantified immediately (B) or after 22 h of recovery in fresh culture medium (C). The results are presented as the mean ± SD of at least three independent experiments. Statistics were calculated by one-way ANOVA followed by Dunnett’s multiple comparison test.
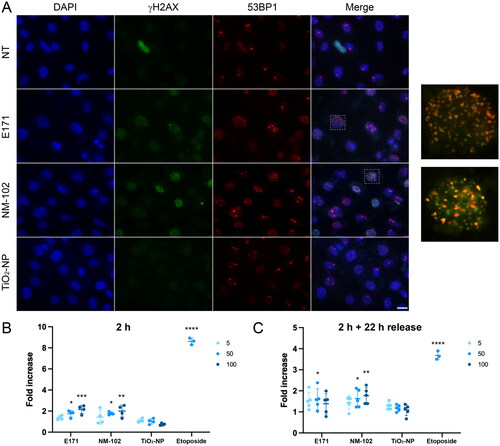
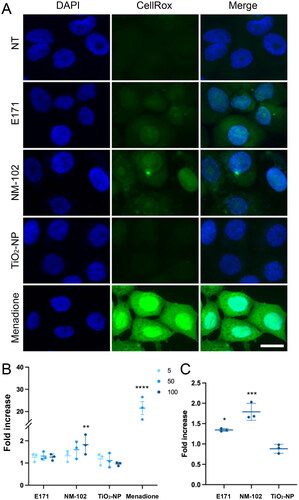
Figure 7. Oxidative stress induced by TiO2 particles in TR146 cells. (A, B) TR146 cells were left untreated (NT) or exposed to 50 µM of menadione or different concentrations (5, 50 or 100 µg/ml) of E171, NM-102 or TiO2-NPs for 2 h, and the presence of reactive oxygen species was quantified by using CellROX® Green Reagent. Representative images (A) and quantification (B) are shown. The results are presented as the mean ± SD of three independent experiments. Statistics were calculated by one-way ANOVA followed by Dunnett’s multiple comparison test. (C) TR146 cells were treated as in A and B with 100 µg/ml TiO2 agents and analyzed after 22 h of recovery in fresh culture medium. The results are presented as the mean ± SD of three independent experiments. Statistics were calculated by one-way ANOVA followed by Dunnett’s multiple comparison test.
Supplemental Material
Download MS Word (4.1 MB)Data availability statement
All data generated or analyzed during this study are included in this published article and its supplementary information files.