
Figures & data
Table 1. Explanation of the columns in the Excel data library.
Figure 1. Overview of content and placement of graphs for each material in the data library.
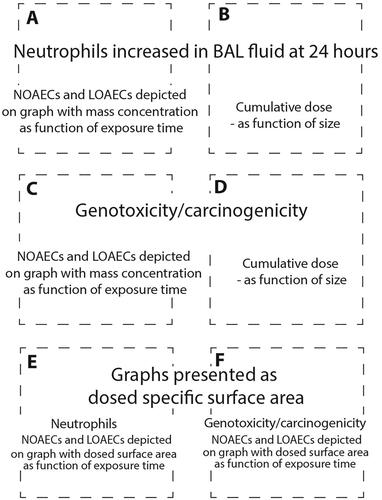
Table 2. Literature references used in the Excel data library and for graphs.
Figure 2. Specific surface area as function of primary particle size. Specific surface area was plotted as function of size for nanomaterials included in the data library for which the information was available. For spherical nanomaterials, the size is presented as diameter (A and B). For carbon nanotubes, the size is presented as either length (C), diameter (D), or aspect ratio (E). For graphene, the size is presented as the length of the edge (lateral size) (F). P values are from the linear regression F-test to test if the slope was significantly non-zero.
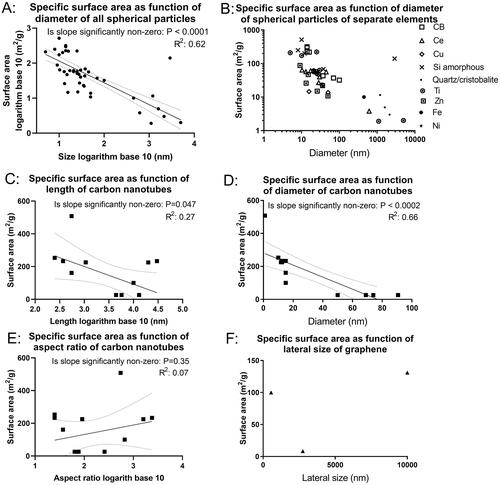
Figure 3. Silver (Ag) dose descriptors.
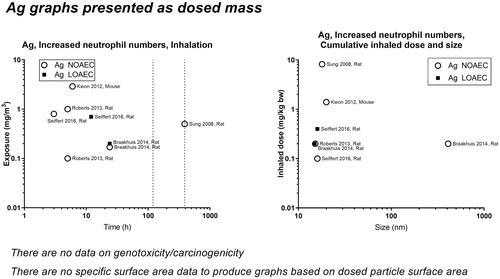
Figure 4. Carbon black (CB) dose descriptors.
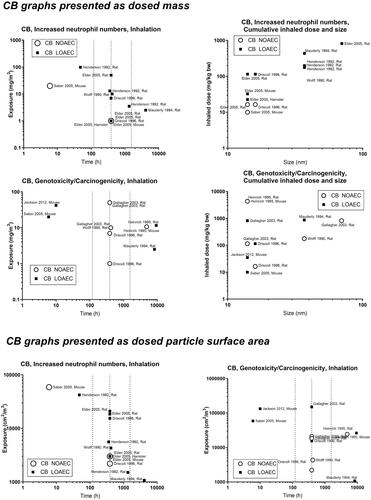
Figure 5. Carbon nanotubes (CNT) dose descriptors and length of the tubes.
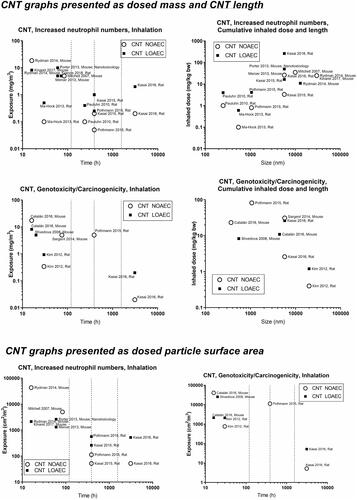
Figure 6. Carbon nanotubes (CNT) dose descriptors and diameter of the tubes.
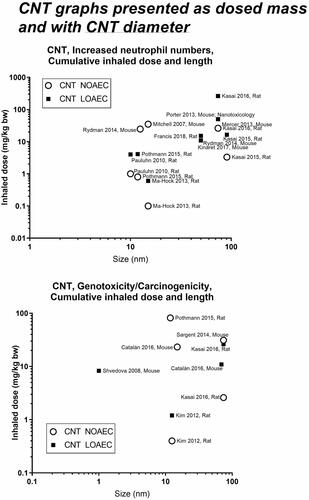
Figure 7. Graphene dose descriptors.
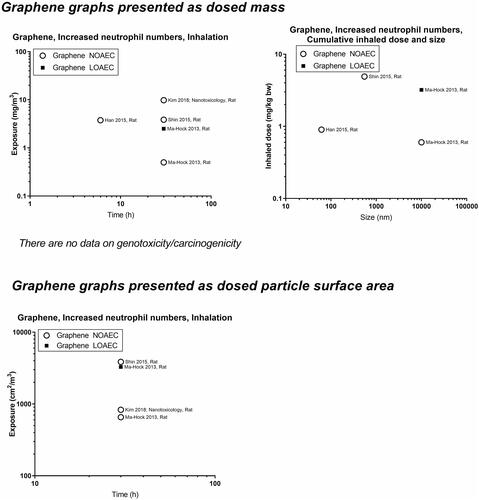
Figure 8. Cerium (CeO2) dose descriptors.
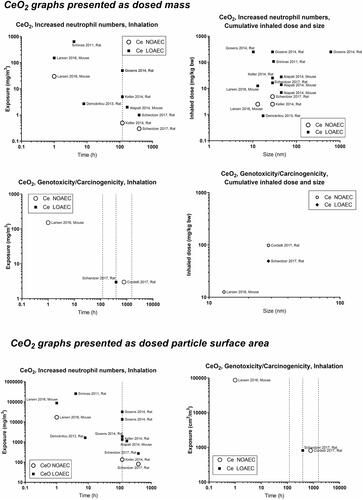
Figure 9. Cobalt (Co) dose descriptors. The data are on CoO compounds, unless otherwise indicated on the graphs with italics.
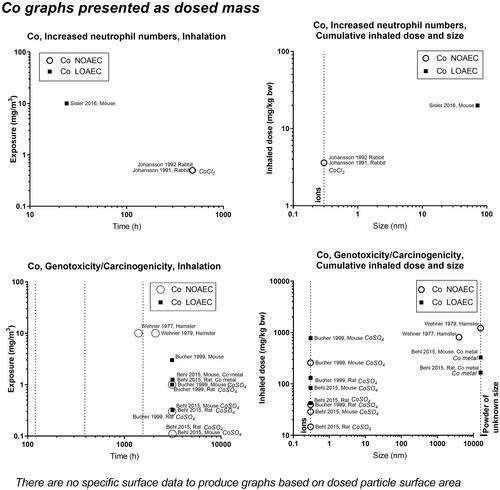
Figure 10. Copper (Cu) dose descriptors.
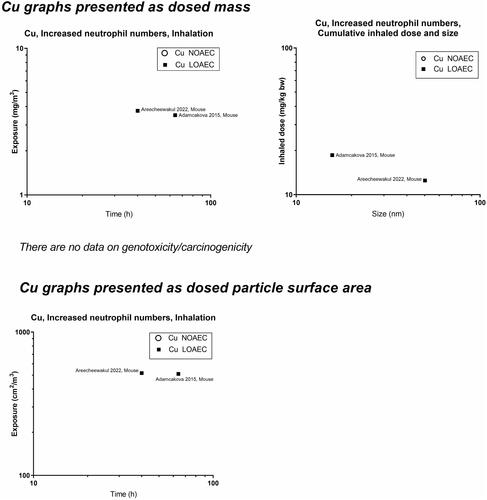
Figure 11. Iron (Fe) dose descriptors. The data are on iron oxides, unless otherwise indicated on the graphs with italics.
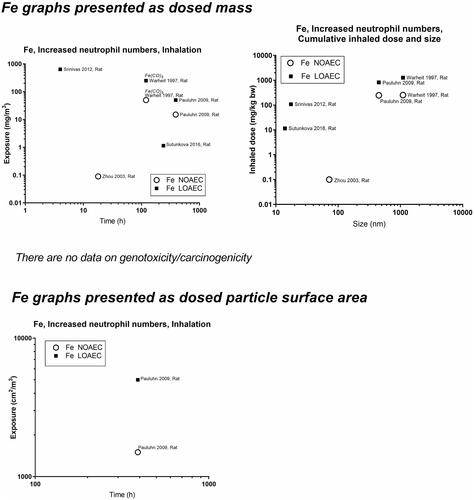
Figure 12. Nickel (Ni) dose descriptors. The data are on NiO compounds, unless otherwise indicated on the graphs with italics.
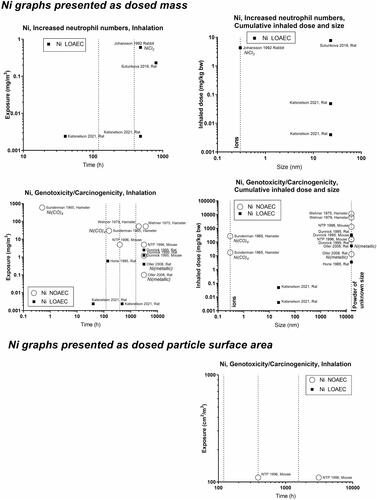
Figure 13. Silica amorphous (Si amorphous) dose descriptors.
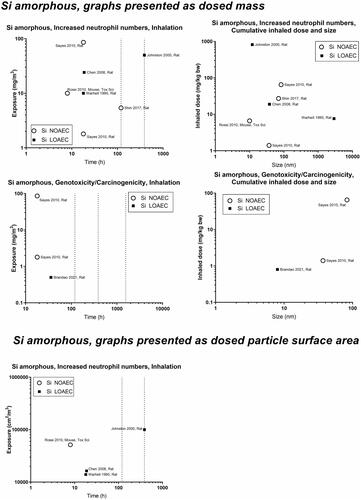
Figure 14. Quartz dose descriptors.
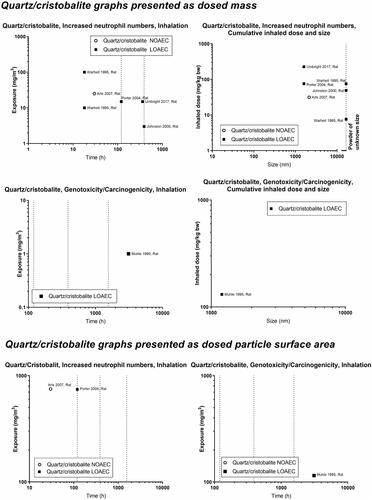
Figure 15. Titanium dioxide (TiO2) dose descriptors.
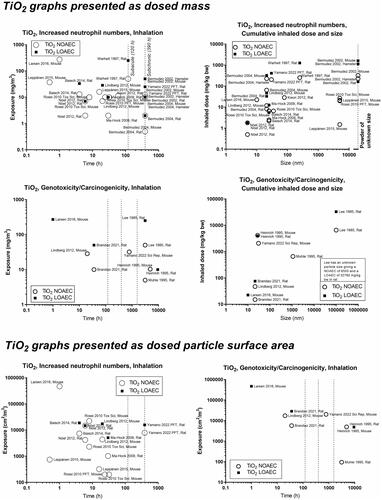
Figure 16. Zinc (Zn) dose descriptors.
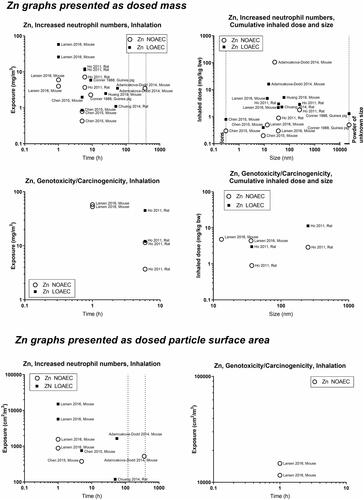
Figure 17. Graphical presentation of T25s calculated based on chronic inhalation studies included in the data library. CNT size for Kasai et al. Citation2016 depicted as length (diameter 74 nm). The upper panel shows T25s as mg/kg bw/day and the lower panel shows T25s as exposure air concentrations (mg/m3).
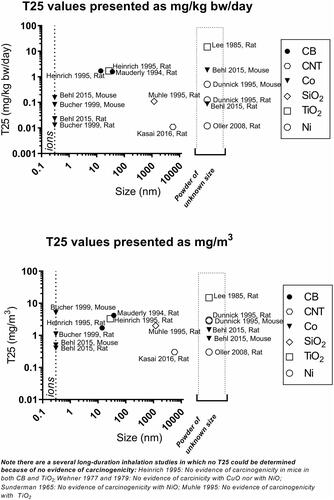
Figure 18. Linear regression of dose descriptors (NOAEC and LOAEC) expressed as mass concentration as function of study duration for all materials taken together. The P values for the F-test testing of whether the slope is significantly non-zero are inserted next to the legends.
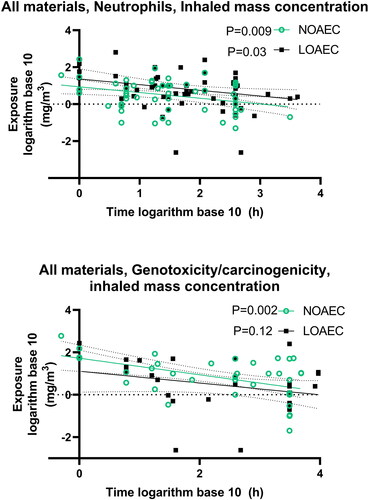
Figure 19. Linear regression showing dose descriptors expressed as surface area exposure as function of study duration for all materials taken together. The unit on the X-axis is logarithm base 10 (hours). P values for the F-test testing if the slope is significantly non-zero are inserted next to the legends.
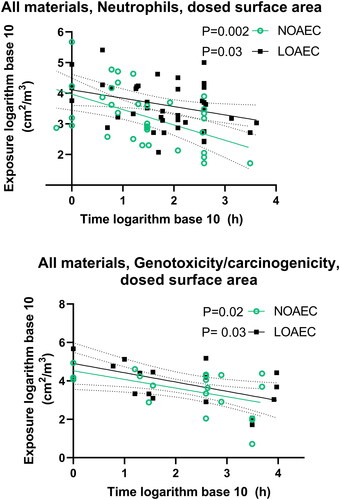
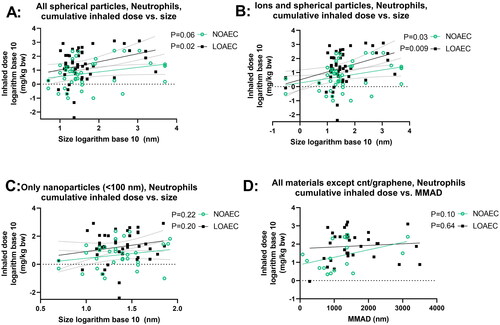
Figure 20. Linear regression of NOAEC and LOAEC for all materials taken together with dose descriptors expressed as cumulative inhaled dose as function of material size or mass median aerodynamic diameter. A shows all spherical particles, B ions and all spherical particles, C only nanoparticles with a diameter of less than 100 nm, D all materials except carbon nanotubes and graphene with mass median aerodynamic diameter (MMAD) on the x-axis. The P values for the F-test testing if the slope is significantly non-zero are inserted next to the legends. For studies where administration was in ionic form, we subtracted the molecular mass of accompanying salts from the administered mass. For particles and bulk materials consisting of oxides, we did not subtract the mass of oxygen.
Supplemental Material
Download MS Word (205.7 KB)Supplemental Material
Download MS Excel (116 KB)Data availability statement
The data that support the findings of this study are openly available are available in the Supplemental materials and on the Nanosafer website at www.nanosafer.org