
Figures & data
Table 1. Physico-chemical properties of the studied reduced graphene oxides (rGO).
Figure 1. Raman spectroscopy structural analysis bands in Graphical form (A) and numerical values (B). FWHM: full width at half maximum; I: intensity of band.
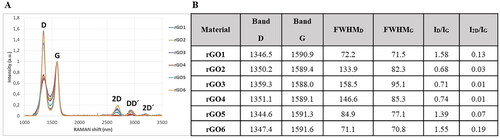
Figure 2. Lateral dimension distribution of reduced graphene oxides (rGOs). size distributions were calculated from the dimensional analysis of transmission electron microscope (TEM) images (A–F) through the ImageJ software. Pictures show representative TEM images (G–L) of rGO1 (A,G), rGO2 (B,H), rGO3 (C,I), rGO4 (D,J), rGO5 (E,K) and rGO6 (F,L). scale bar: 500 nm (H,J,L); 200 nm (K); 100 nm (G,I).
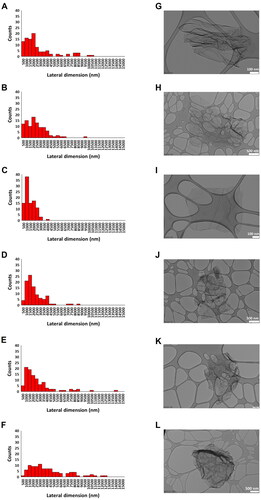
Figure 3. Endotoxin detection in reduced graphene oxides (rGOs) using the TNF-α expression test (TET assay). macrophages obtained by differentiation from the human monocytic THP-1 cell line were exposed for 24 h to rGO1 – rGO6 at a non-cytotoxic concentration (1 µg/ml) in presence or absence of polymyxin B sulfate (10 µM). as positive control, macrophages were exposed to 100 ng/ml LPS. The red dashed line represent the 0.5 EU/ml acceptable limit suggested by the U.S. FDA. Results are the mean ± SE of three independent experiments.
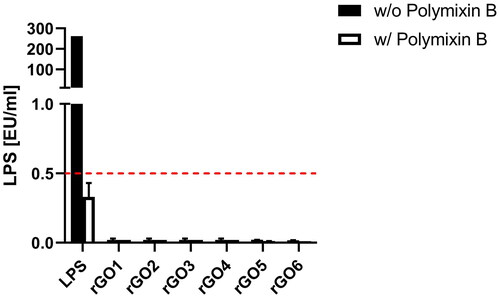
Figure 4. Effects of rGO1-rGO6 on 16HBE14o − cell viability evaluated by the CellTiter-GloVR Luminescent Cell Viability assay after 3 h (A,C,E) and 24 h (B,D,F) exposure. Data are reported as % of living cells compared to untreated controls (100% of living cells) and represented as the mean ± SEM of three independent experiments. The grey bar represents the range of 45 ± 5% cell viability (corresponding to the 55 ± 5% cytotoxicity) below which doses should not be included in the genotoxicity assays. Statistical differences *: p < .005; **: p < .001; ***: p < .0005; ****: p < .0001 (two-way ANOVA and Bonferroni’s post-test).
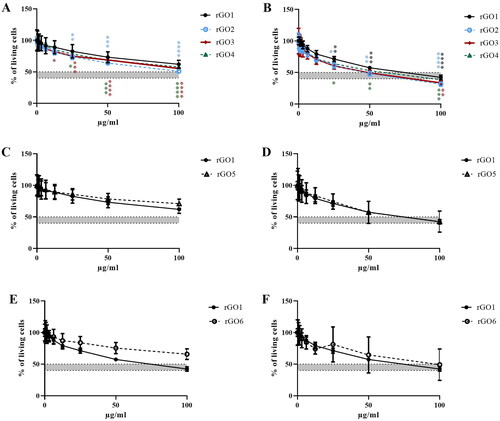
Figure 5. Effects of rGO1 − rGO6 on 16HBE14o − cells viability evaluated by the WST-8 assay after 3 h (A,C,E) and 24 h (B,D,F) exposure. Data are reported as % of cell viability in cells exposed to rGOs with respect to untreated control cells (negative control) and represented as the mean ± SE of 3 independent experiments performed in triplicate. Statistical differences vs rGO1: *p < .05; **p < .01; ***p < .001; ****p < .0001 (two-way ANOVA and Bonferroni’s post-test).
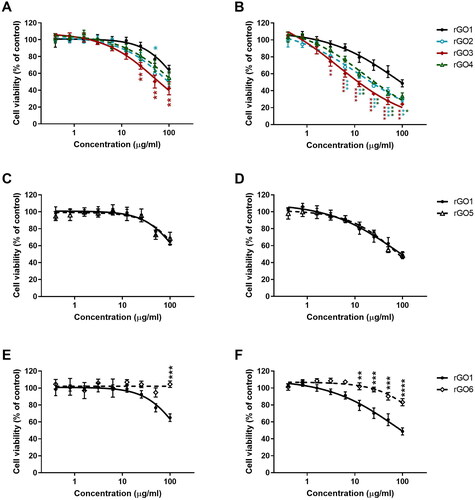
Figure 6. Reactive oxygen species (ROS) production in 16HBE14o − cells after exposure to rGO1 − rGO6 for 3 h (A,C,E) or 24 h (B,D,F), evaluated by the DCFDA assay. Results are expressed as % of ROS increase with respect to negative control (cells not exposed to rGOs) and represented as the mean ± SE of at least 3 independent experiments performed in triplicate. Statistical differences vs rGO1: **p < .01; ***p < .001; ****p < .0001 (two-way ANOVA and Bonferroni’s post-test).
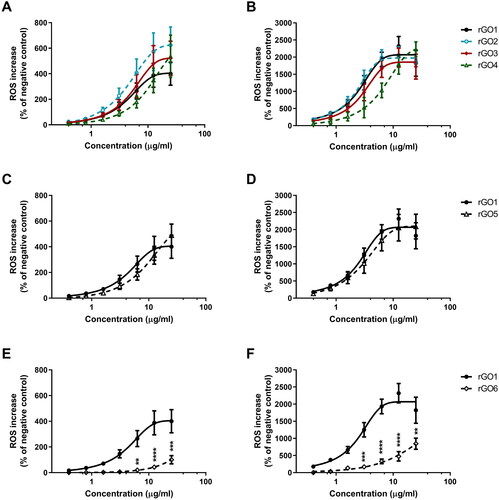
Figure 7. Release of pro-inflammatory mediators by 16HBE14o − cells exposed to rGO1 – rGO6 (10 μg/ml) for 24 h. After 24 h exposure, cell media were collected and IL-1α (A), IL-1β (B), IL-6 (C), IL-18 (D), TNF-α (E), GM-CSF (F), INF-γ (G), MCP-1 (H), RANTES (I), IL-8 (J), ECF/CCL11 (K), PG-E2 (L) were measured by specific ELISA assays. Cells were exposed to LPS 1 µg/ml as a positive control or Mitsui-7 MWCNT 1 µg/ml as a reference material. The data, reported as pg/ml of each mediator released in the media, are represented as the mean ± SE of three independent experiments. Statistical differences vs negative controls: *, p < .05; **, p < .01; ****, p < .0001 (one-way ANOVA and Bonferroni’s post-test); statistical differences vs rGO1: #, p < .05; ##, p < .01; ###, p < .001 (one-way ANOVA and Bonferroni’s post-test).
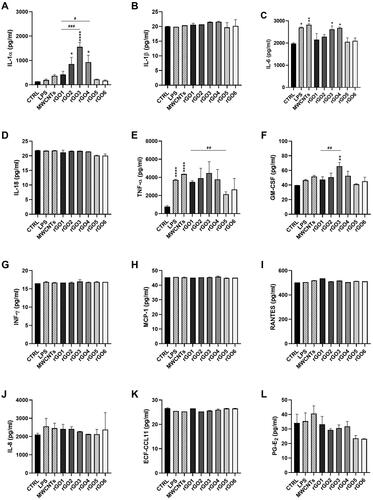
Figure 8. DNA damage induction in 16HBE14o- cells after exposure to rGO1 – rGO6 for 3 and 24 h, assessed by the comet assay. Results are expressed as the % DNA in tail and represented as the mean ± SD of two independent experiments. Int: interference control; PC: positive control (20 mM H2O2). *: p < .005; **: p < .001; ***: p < .0005; ****: p < .0001.
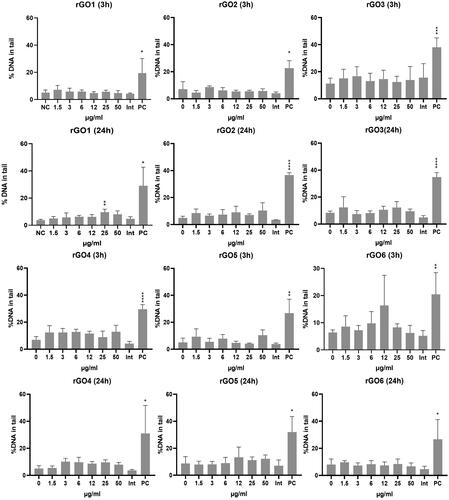
Figure 9. Micronuclei (MN) induction in 16HBE14o- cells after exposure to rGO1-rGO6 for 24 h. Results are expressed as MN fold increase over the negative control (±SD, bars) and relative cell survival (RS %, ±SD, line). NC: negative control; PC: positive control (Mitomycin C; 50 ng/ml); *: p < .05. The dotted lines indicate the maximum acceptable toxicity range according to the OECD TG 487.
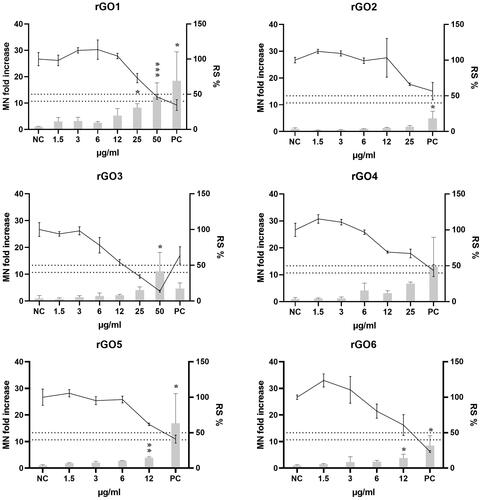
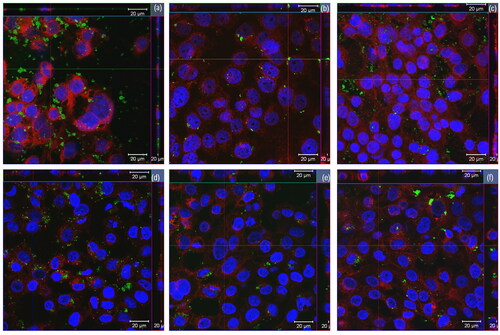
Figure 10. Orthogonal view of confocal images of the 16HBE14o- cells treated for 24 h with (A) 25 µg/ml of rGO1, (B) 12 µg/ml of rGO2, (C) 12 µg/ml of rGO3, (D) 25 µg/ml of rGO4, (E) 25 µg/ml of rGO5 and (F) 25 µg/ml of rGO6. Cell nuclei: blue; cell membranes: red; rGOs: green.
Supplemental Material
Download PDF (558.2 KB)Data availability statement
All data generated in this study is included in the current publication and its supplementary information files.