
Figures & data
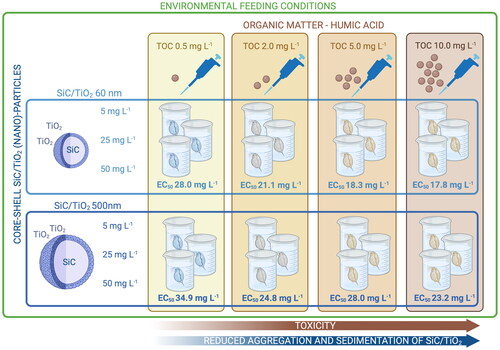
Figure 1. Hydrodynamic sizes (mean ± standard error) of 60 and 500 nm SiC/TiO2 between 0 and 48 hours of incubation in Elendt M7 medium with varying TOC concentrations (0, 0.5, 2, 5, and 10 mg L−1).
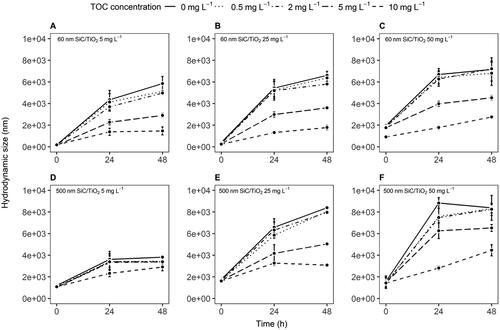
Figure 2. Sedimentation rates (expressed as the percentage of the nominally applied particle mass remaining in suspension, A–F, mean ± standard error) and time-weighted average (TWA) water column concentrations (G–I, mean ± standard error) of 60 and 500 nm SiC/TiO2 after 0, 24, and 48 hours measured in Elendt M7 medium in the presence of varying total organic carbon (TOC) concentrations (i.e. 0, 0.5, 2, 5, and 10 mg L−1).
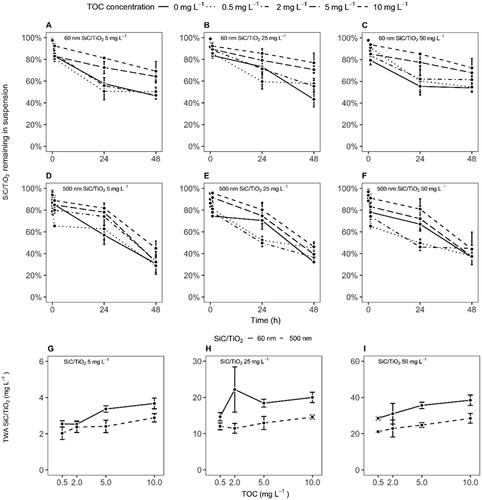
Figure 3. Correlation between time-weighted average hydrodynamic sizes and sedimentation rates (expressed as a percentage of the nominally applied particle mass remaining in suspension) of 60 and 500 nm SiC/TiO2 in Elendt M7 medium (mean ± 95% confidence interval). Values of nominal SiC/TiO2 concentrations (5, 25, and 50 mg L−1) and total organic carbon (TOC) concentrations (i.e. 0, 0.5, 2, 5, and 10 mg L−1) are aggregated.
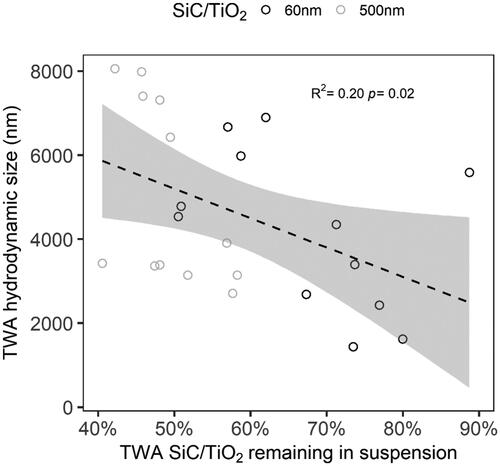
Figure 4. Percentage of surviving D. magna (mean ± standard error) over 21 days of exposure to 60 and 500 nm SiC/TiO2 (5, 25, and 50 mg L−1) in the presence of varying total organic carbon (TOC) concentrations, i.e. 0.5 mg L−1 (A and E), 2 mg L−1 (B and F), 5 mg L−1 (C and G), and 10 mg L−1 (D and H).
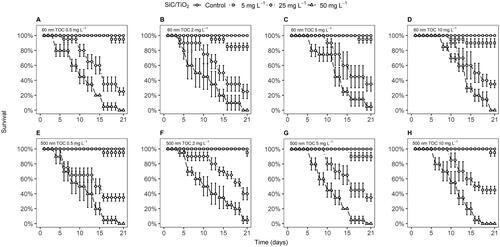
Table 1. EC50 values derived from dose–response models based on the percentage of surviving D. magna over 21 days of exposure to 60 and 500 nm SiC/TiO2 (i.e. 5, 25, and 50 mg L−1) in the presence of varying total organic carbon (TOC) concentrations (i.e. 0, 0.5, 2, 5, and 10 mg L−1) calculated using different dose metrics.
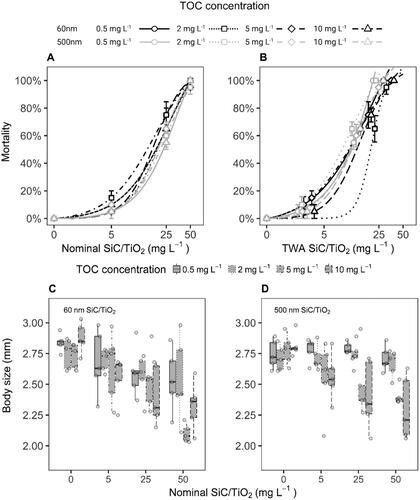
Figure 5. Dose–response curves (A and B) based on mortality rates and body sizes (C and D) of D. magna after 21 days of exposure to 60 and 500 nm SiC/TiO2 (5, 25, and 50 mg L−1) in the presence of varying total organic carbon (TOC) concentrations (i.e. 0.5, 2.0, 5, and 10 mg L−1). Dose–response curves were calculated using nominal and time-weighted average (TWA) treatment concentrations. Error bars in dose-response curves represent standard errors.
Supplemental Material
Download Zip (4.9 MB)Data availability statement
The data that support the findings of this study are available from the corresponding author, KS, upon reasonable request.