Figures & data
Table 1. Listing of the participants, projects, materials and techniques of the different programs.
Figure 1. Micro-CT images of C–C and Cf–UHTC composites after 60 s oxyacetylene torch test [Citation17]. C-C carbon-carbon benchmark; Cf-ZrB2 carbon fibre – ZrB2; Cf-ZS20 carbon fibre-ZrB2-20 vol.-% SiC; Cf-ZS20-1La carbon fibre-ZrB2-20 vol.-%SiC-10 vol.-% LaB6; Cf-HfB2 carbon fibre-HfB2; Cf-HfC carbon fibre-HfC.
![Figure 1. Micro-CT images of C–C and Cf–UHTC composites after 60 s oxyacetylene torch test [Citation17]. C-C carbon-carbon benchmark; Cf-ZrB2 carbon fibre – ZrB2; Cf-ZS20 carbon fibre-ZrB2-20 vol.-% SiC; Cf-ZS20-1La carbon fibre-ZrB2-20 vol.-%SiC-10 vol.-% LaB6; Cf-HfB2 carbon fibre-HfB2; Cf-HfC carbon fibre-HfC.](/cms/asset/7a60c2e2-e1c5-4b93-928c-7f647901e655/yaac_a_1475140_f0001_ob.jpg)
Figure 2. (a) MBDA demonstrator part and (b) DSTL large panels manufactured with Cf-HfB2 composite.
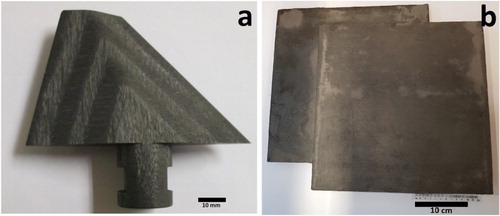
Table 2. Characteristics of OAT and OPT.
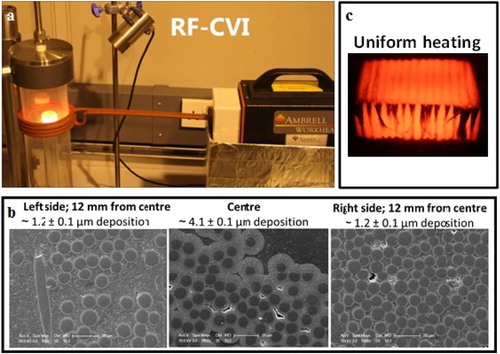
Figure 3. (a) RF-CVI facility, (b) the C deposition distribution on a cylindrical plain 2.5D Cf preform after 2 h infiltration and (c) rectangular Cf preform heated uniformly by RF during CVI densification process.