Figures & data
Figure 1. Schematic of the RMI process.
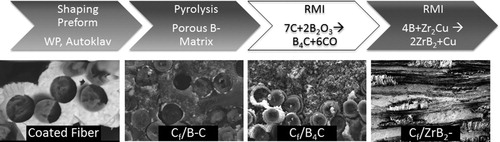
Figure 2. Matrix micro-structure before (a) and after BO
infiltration (b).
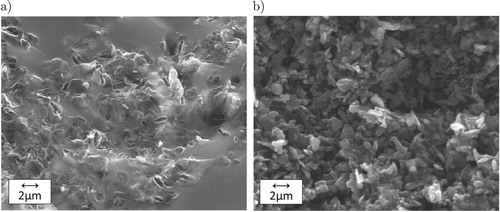
Figure 3. Pore size distribution of pyrolysed polycarbosilane, phenolic resin and phenolic resin after BO
infiltration.
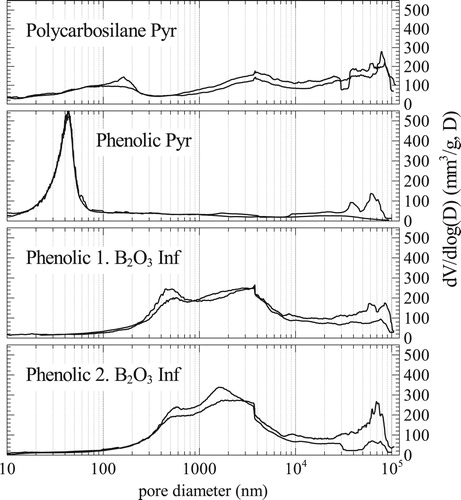
Figure 4. XRD of pyrolysed phenolic samples with and without BO
infiltration.
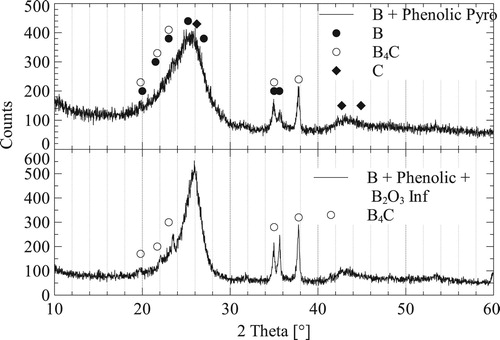
Figure 5. Carbon fibres with TiB coating after (a) 2h and (b) 4h CVD coating time.
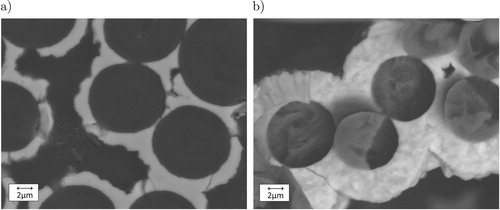
Figure 6. Viscosity in dependence of temperature at three different shear rates for different melts.
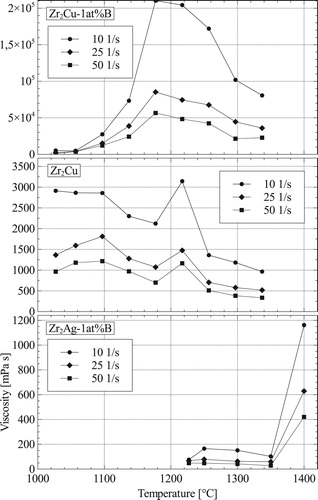
Figure 7. Contact angles of different melt alloys on C and SiC substrates.
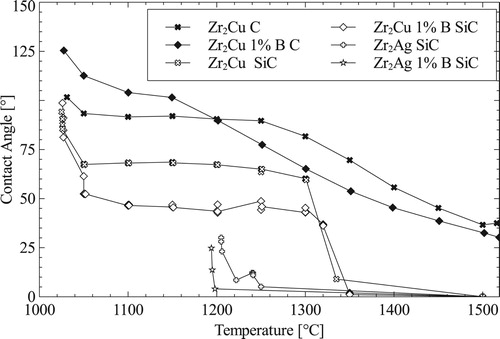
Figure 8. Matrix variations within the micro-structure when using different melts and preforms.
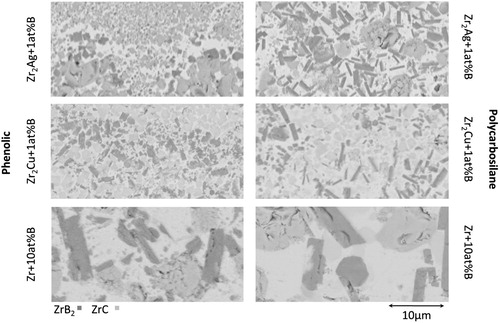
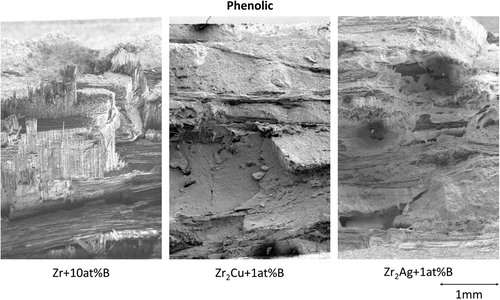
Figure 9. Fracture surface after 3PB of the phenolic preform for each of the three melts.